
Making sense of reams of data seems like a uniquely modern problem. Yet historians have been doing it for centuries, reviewing archived sources, constructing analytical frameworks, and fashioning stories and arguments. Now, computational tools—along with a proliferation of digital source materials—are opening up new ways of understanding history, and historians and computer scientists are coming together to explore the possibilities. Housed under the broader rubric of digital history (which encompasses everything from digital publishing to digital texts and research resources), the nascent field of computational history promises nothing less than to change the way we interact with the past.
For Adam Jatowt, a professor at the University of Kyoto’s Department of Social Informatics, computational history offers a way to integrate a personal interest in history with his research in document summarization techniques. After receiving a 2011 research grant from the Japan Science and Technology Agency, Jatowt and collaborator Ching-man Au Yeung began to investigate the concept of collective memory through the large-scale text mining of a dataset of international news articles. First, they analyzed the frequency of references to past years; unsurprisingly, with the exception of peaks that correspond to crucial events like the end of World War II, these tend to decline over time. (Jatowt refers to the decline, which is exponential, as the “remembering curve,” in homage to the “forgetting curve” through which 19th century psychologist Hermann Ebbinghaus described the decline of personal memory retention.)
Jatowt and Yeung then used a common topic detection model known as Latent Dirichlet Allocation (LDA) to obtain the probability distributions of topics in their corpus. This enabled the researchers to compare the topics that are now linked to a given year with those actually discussed during that year, “so we can compare the current view of the past with what was popular at the time,” Jatowt explains. Some events were important in their day and are now forgotten; the importance of other events is clear only in retrospect. Jatowt and Yeung give the example of the year 1978, which is now thought to mark the end of China’s Cultural Revolution; at the time, they point out, Chinese media focused more on events like the signing of the Treaty of Peace and Friendship between China and Japan.
“How many documents can a historian read each year? Machines can scan a much larger amount of content and find connections.”
“Computational history is a complement to the historian’s work,” says Jatowt. “How many documents can a historian read each year? Machines can scan a much larger amount of content and find connections.”
Benjamin Schmidt, a graduate student in Princeton’s history department and visiting graduate fellow at the Cultural Observatory at Harvard, agrees. “Computation is really the only way to grapple with large datasets,” he asserts. “You can’t read a few books and understand things like the way language changes over time.” Yet computational history, says Schmidt, has the potential to do more than crunch data in support of traditional theses about the past. It also gives researchers a way to make sense of resources that are intractable to traditional scholarship. On his blog Sapping Attention, Schmidt has experimented with visualizing the vast amounts of data from shipping logs, enabling viewers to see ships’ trajectories over time. “Data lets historians tell engaging stories that aren’t narratives, and that tap into a source of explanations slightly removed from the actions of individuals or networks,” he wrote in one post.
Researchers at Google explored the point in a recent study of fame. Citing the popularly held belief that technology has shortened both news cycles and attention spans, James Cook, Atish Das Sarma, Alex Fabrikant, and Andrew Tomkins mined a collection of 20th century news articles to analyze whether the average famous person’s time in the spotlight—as measured by the duration of a single news story about that person and the overall duration of public interest in him or her—has changed over time. The conclusion: “through many decades of rapid technological and societal change, through the appearance of Twitter, communications satellites, and the Internet, fame durations did not increase, neither for the typical case nor for the extremely famous.”
Computational history offers a way to generate dynamic insights as well. Historian William Turkel, a professor at the University of Western Ontario, cites the example of the Old Bailey Online, which contains records of the trials held at London’s central criminal court between 1674 and 1913. “The records have been marked up with XML, making it easy, say, to discover how many people were convicted of coining offenses in the 1770s,” he explains. Through the OB Online’s API, researchers can write a program to obtain the same information. “Now suppose I want to publish something about the technology of counterfeiting. I could look up and write down the facts that I need, which could then be published online or on paper. But I also have the possibility of writing a program which dynamically queries the OB via its API. If the information in the OB database is updated, my program will automatically get the latest results. Furthermore, I can mash up live information from a number of different sources, and incorporate new sources as they come online.”
Unlike many historians, Turkel learned how to program as a child, empowering him to create and customize the tools he needs. For his work on Old Bailey, he is collaborating with experts on 18th-century British history and using Mathematica to investigate historical questions. As they work, the group’s interpretations evolve, while Mathematica’s notes and Computable Document Files enable them to keep prose, code, data, and visualizations together in a live document.
“Computation is really the only way to grapple with large datasets. You can’t read a few books and understand things like the way language changes over time.”
“History is still what we make of the past, but our understanding becomes much more dynamic,” asserts Turkel.
Computationally driven dynamism also holds pedagogical promise. In addition to making history more accessible through online tools and research collections, it offers an alternative to the traditional output of historical research: narrative. Resources like the University of Virginia’s online Valley of the Shadow project enable visitors to construct their own paths through history by exploring letters, diaries, newspapers, and public records from two communities during the Civil War. Created by UVA historians William Thomas and Edward Ayers, the project was conceived as an “applied experiment in digital scholarship,” as they wrote in an introductory article.
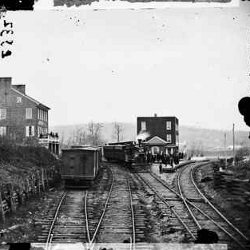
Thomas now teaches at the University of Nebraska-Lincoln, where he is working on a collaborative project called Railroads and the Making of Modern America, which leverages computation to explore railroad data like cartoons, poetry, maps, timetables, and abandoned track lines. “The Valley of the Shadow project told big history through personal eyes,” Thomas says. “We are looking to use big history to get a perspective on the individual.” Thanks to a 2009 grant from the National Endowment for the Humanities’ Digging into Data challenge, Thomas and colleagues like Ian Cottingham, in UNL’s computer science department, were able to visualize the growth of the railroad network by relating data from annual reports to other geospatial data pulled from censuses, newspapers, and the work of other scholars. “The grant allowed us to bring that data into a common visual spatiotemporal representation,” Thomas explains. Doing the same for other datasets, however, remains an ongoing challenge. “There is so much textual and visual data—maps, timetables, newspaper advertisements and articles, and individual writings. Annual reports are different across companies and even within companies from year to year.”
As pedagogical tools, and even as scholarship, such projects remain experimental. “We know what it means to read a book,” says Schmidt. But what does it mean to engage with an online tool or data visualization? “If you tell students to look at a website… well, sometimes they’ll just go look at the website without a whole lot of thought.” On the other hand, according to Turkel, students often produce highly creative work in the form of blog posts, wiki entries, websites, Twitter feeds, and YouTube videos.
“As is often the case with interdisciplinarity, the best collaborations tend to be represented by individuals who have training both in the humanities and in applied sciences.”
A more pressing challenge is that while interest in computational history continues to grow, few historians actually know how to program. Collaborations like UNL’s railroad project offer one solution. Yet as Turkel points out, “something that may be technically uninteresting from a CS perspective may be very interesting when applied to a problem in the humanities, and vice versa. As is often the case with interdisciplinarity, the best collaborations tend to be represented by individuals who have training both in the humanities and in applied sciences.”
To help train others in his field, Turkel and a colleague at the University of Western Ontario’s history department, Alan MacEachern, created The Programming Historian. First conceived as a set of online lessons designed to teach practical computer programming skills to humanists, it has since evolved into a collaborative open access textbook, with peer-reviewed contributions from volunteers. “Though many historians are not currently able to do the ‘technical heavy lifting,’ my experience with [The Programming Historian] has convinced me that a lot of people aspire to doing that kind of work,” says Turkel.
The University of London’s Institute of Historical Research (IHR) also recently released a set of free online training courses in semantic markup and text mining. The courses are tailored to historians but also, as IHR project editor Jonathan Blaney explained in an online report, would “be of benefit to any interested humanities scholars.” Funded by JISC, a charity that works to promote the use of digital technologies in U.K. higher education, the courses were posted under a creative commons license in the hopes that others will continue to help develop the material.
Schmidt offers the analogy of learning languages. “If you know an obscure language like Syriac, it opens up all sorts of interesting research. I think historians are starting to realize that computational expertise adds an extra layer of depth to their projects.”
Further Reading
Blaney, Jonathan et al.
Histore: Historians’ Online Research Environments. http://historeproject.wordpress.com/
Ching Man Au Yeung and Adam Jatowt:
“Studying How the Past is Remembered: Towards Computational History through Large Scale Text Mining.” Proceedings of the 20th ACM Conference on Information and Knowledge Management, Glasgow, UK: ACM Press, 2011. http://www.dl.kuis.kyoto-u.ac.jp/~adam/cikm11a.pdf
Cook, James et al.
“Your Two Weeks of Fame and Your Grandmother’s.” WWW 2012, April 1620, 2012, Lyon, France. http://www2012.org/proceedings/proceedings/p919.pdf
Thomas, William G. III and Edward L. Ayers.
The Valley of the Shadow Project. http://valley.lib.virginia.edu/
Thomas, William G. III et al.
Railroads and the Making of Modern America. http://railroads.unl.edu/
Turkel, William J., Alan MacEahearn et al.
The Programming Historian 2. http://programminghistorian.org/about/project-team

Join the Discussion (0)
Become a Member or Sign In to Post a Comment