Visual communication via diagrams, sketches, charts, photographs, video, and animation is fundamental to the process of exploring concepts and disseminating information. The most-effective visualizations capitalize on the human facility for processing visual information, thereby improving comprehension, memory, and inference. Such visualizations help analysts quickly find patterns lurking within large data sets and help audiences quickly understand complex ideas.
Over the past two decades a number of books10,15,18,23 have collected examples of effective visual displays. One thing is evident from inspecting them: the best are carefully crafted by skilled human designers. Yet even with the aid of computers, hand-designing effective visualizations is time-consuming and requires considerable effort. Moreover, the rate at which people worldwide generate new data is growing exponentially year to year. Gantz et al.5 estimated we collectively produced 161 exabytes of new information in 2006, and the compound growth rate between 2007 and 2011 would be 60% annually. We are thus expected to produce 1,800 exabytes of information in 2011, 10 times more than the amount we produced in 2006. Yet acquiring and storing this data is, by itself, of little value. We must understand it to produce real value and use it to make decisions.
The problem is that human designers lack the time to hand-design effective visualizations for this wealth of data. Too often, data is either poorly visualized or not visualized at all. Either way, the results can be catastrophic; for example, Tufte24 explained how Morton Thiokol engineers failed to visually communicate the risks of launching the Challenger Space Shuttle to NASA management in 1986, leading to the vehicle’s disasterous failure. While Robison et al.20 argued the engineers must not be blamed for the Challenger accident, better communication of the risks might have prevented the disaster.
Skilled visual designers manipulate the perception, cognition, and communicative intent of visualizations by carefully applying principles of good design. These principles explain how visual techniques can be used to either emphasize important information or de-emphasize irrelevant details; for example, the most important information in a subway map is the sequence of stops along each line and the transfer stops that allow riders to change lines. Most subway passengers do not need to know the true geographic path of each line. Based on this insight, map designer Harry Beck redesigned the map of the London Underground in 1933 using two main principles: straightening the subway lines and evenly spacing the stops to visually emphasize the sequence of stops and transfer points (see Figure 1).
Such design principles connect the visual design of a visualization with the viewer’s perception and cognition of the underlying information the visualization is meant to convey. In the field of design, there is a long-standing debate regarding the interaction of aesthetic and functional properties of designed artifacts. We do not seek to engage in this debate here; rather, we focus on how particular design choices affect the perception and cognition of the visualization, not the aesthetic style of the visualization. Accordingly, we use the term “design principle” as a shorthand for guidelines that help improve viewers’ comprehension of visually encoded information.
Design principles are usually not strict rules, but rules of thumb that might even oppose and contradict one another. For instance, Beck did not completely straighten the subway lines; he included a few turns in them to give viewers a sense of a line’s overall spatial layout. Skilled visual designers implicitly apply the relevant design principles and balance the trade-offs between them in an iterative process of creating example designs, critiquing the examples, and improving the designs based on the critiques. Designers usually do not directly apply an explicitly defined set of design principles. The principles are a form of tacit knowledge that designers learn by creating and studying examples. It is far more common for books on visual design to contain visual examples rather than explicit design principles.
Many of the analysts and end users inundated with data and charged with creating visualizations are not trained designers. Thus, our work aims to identify domain-specific design principles, instantiating them within automated visualization design systems that enable non-designers to create effective visual displays. While other researchers have considered specific ways to use cognitive design principles to generate visualizations (see the online appendix) we have been developing a general, three-stage approach for creating visualization design systems:
Stage 1. Identify design principles. We identify domain-specific design principles by analyzing the best hand-designed visualizations within a particular information domain. We connect this analysis with research on perception and cognition of visualizations;
Stage 2. Instantiate design principles. We encode the design principles into algorithms and interfaces for creating visualizations; and
Stage 3. Evaluate design principles. We measure improvements in information processing, communication, and decision making that result from our visualizations. These evaluations also serve to validate the design principles.
We have used this three-stage approach to build automated visualization design systems in two domains: cartographic visualization and technical illustration. In the domain of cartographic visualizations we have developed automated algorithms for creating route maps1,3,12 and tourist maps of cities.8 In the domain of technical illustration we have developed automated techniques for generating assembly instructions of furniture and toys2,9 and for creating interactive cutaway and exploded-view illustrations of complex mechanical, mathematical, and biological objects.11,13,14,19 Here, we focus on articulating the techniques we have used to identify and evaluate the design principles for each domain. These techniques generalize to other domains, and applying our three-stage approach will result in a better understanding of the strategies people use to make inferences from visualizations.
Stage 1. Identify Design Principles
Design principles are prescriptive rules describing how visual techniques affect the perception and cognition of the information in a display. In some cases, they are explicitly outlined in books; for example, books on photography techniques explain the rules for composing pleasing photographs (such as cropping images of people just below the shoulders or near the waist, rather than at the neck or the knees). Researchers have directly applied them to build a variety of automated photo-manipulation algorithms (see the online appendix for examples).
However, our experience is that design principles are rarely stated so explicitly. Thus, we have developed three strategies for extracting and formulating domain-specific design principles: (1) analyze the best hand-designed visualizations in the domain, (2) examine prior research on the perception and cognition of visualizations, and, when necessary, (3) conduct new user studies that investigate how visual techniques affect perception and cognition.
Hand-designed visualizations. We have found that a useful first step in identifying design principles is to analyze examples of the best visualizations in the domain. This analysis is designed to find similarities and recurring patterns in the kinds of information the visualizations highlight, as well as the techniques used to emphasize the information.
Consider the problem of depicting the internal structure of complex mechanical, mathematical, anatomical, and architectural objects. Illustrators often use cutaways and exploded views to reveal such structure. They carefully choose the size and shape of cuts, as well as the placement of the parts relative to one another, to expose and highlight the internal structure and spatial relationships between parts. We have analyzed a large corpus of cutaways and exploded views to identify the principles and conventions expert illustrators commonly use to generate these images.11,13,14,19 Our process for identifying these principles is based on three main objectives:
Style independence. In order to identify a general set of principles we could apply to a variety of complex 3D objects, we looked for visual techniques common across different artistic styles and types of objects;
Generative rules. To ensure that we could apply the principles in a generative manner to create cutaways or exploded views, we formed explicit, well-defined rules describing when and how each principle should be applied. We designed the rules to be as general as possible while remaining consistent with the evidence from the example illustrations; and
Perceptual/cognitive rationale. We motivated each principle by hypothesizing a perceptual or cognitive rationale explaining how the convention helps viewers better understand the structure of the 3D object depicted.
Through this analysis, we identified a set of general, perceptually motivated design principles for creating cutaways and exploded views. For instance, the size and shape of cuts in a cutaway illustration are often designed to not only reveal internal parts but to help viewers mentally reconstruct any occluding geometry that has been removed. Thus, illustrators cut radially symmetric objects with wedge-shape cutaways that emphasize the object’s cylindrical structure. Similarly, rectangular objects are cut with object-aligned cutting planes, or box cuts; skin-like covering surfaces are cut using window cuts; and long tubular structures are cut using transverse tube cuts. Illustrations of complex mathematical surfaces often use exploded views in which each slice is positioned to reveal local geometric features (such as symmetries, self-intersections, and critical points). We have also examined “how things work” illustrations designed to show the movement and interaction of parts within a mechanical assembly. The hand-designed illustrations often use diagrammatic motion arrows and sequences of frames to help viewers understand the causal chains of motion that transform a driving force into mechanical movement. After identifying the design principles, we implemented them algorithmically within interactive systems for generating cutaways, exploded views, and how-things-work illustrations (see Figures 2, 3, and 4).
We applied a similar approach to identify the design principles for depicting route maps that provide directions from one location to another1,3 and destination maps that show multiple routes from all around a region to a single location (such as an airport or a popular restaurant).12 We analyzed a variety of such hand-drawn maps and found they are often far more useful than computer-generated driving directions (available at sites like maps. bing.com and maps.google.com) because they emphasize roads, turning points, and local landmarks. These hand-designed maps significantly distort the distance, angle, and shape of roads while eliminating many details that would only serve to clutter the map. Tufte23 pointed out that triptiks and subway maps similarly distort the shape of routes and eliminate unnecessary detail. Hand-designed destination maps include only the major routes to a location rather than all possible routes. These maps progressively increase the level of detail, showing only the highways far from the destination while including arterial roads and finally the residential roads near the destination. Both route and destination maps typically use multi-perspective rendering in which the roads are drawn in top-down plan view while important landmark buildings are drawn from a side view so their facades are visible.
Although analyzing hand-designed visualizations is often a good initial approach for identifying design principles, this strategy also involves limitations. In some cases it may be tempting to form generative rules that are too specific and do not apply outside the range of analyzed examples. In other cases the rules may be so general it is unclear how to apply them to specific examples. Such difficulties often arise when the perceptual or cognitive rationale behind a particular visual technique is not clear. In the context of route maps, for example, although our analysis revealed that mapmakers often distort road length, angle, and shape, it was not immediately clear how such distortions improved the perception and cognition of route maps.
Similarly, we have found that one of the challenges in analyzing hand-designed visualizations is to factor out differences due to artistic style. Designers may choose visual attributes (such as font type, color palette, and line width) for aesthetic reasons whereby one font may simply look nicer than another to the designer. Although such aesthetic design choices are important considerations, the goal of our analysis is to determine how the design choices improve the perception and cognition of the information, rather than how these choices improve aesthetics. The difficulty is that these design choices often affect both the aesthetics of the display and the perception and cognition of the information; how to separate the two effects is not always clear.
In light of these limitations and challenges, we have found it is often useful to connect our observations and hypotheses from the analysis of hand-designed examples with relevant work from perception and cognitive psychology. These connections serve to clarify the perceptual or cognitive rationale for the design principles.
Prior work in perception and cognition. In some cases, prior research in perception and cognition suggests or formalizes the appropriate design principles; for example, cognitive psychologists have shown that people think of routes as a sequence of turns25 and that when following a route the exact length of a road is far less important than properly executing the turns. The topology of the route is more important than its absolute geometry. This insight helps explain why hand-drawn maps often distort geometry—distance, angle, and shape of roads—to ensure that all roads and turning points are visible, but almost never modify the topology of the route.
In this case, the prior research confirmed and formalized the perceptual/cognitive rationale for the visual techniques we first noticed when analyzing hand-drawn route maps. Based on the resulting design principles, we developed LineDrive (http://vis.berkeley.edu/LineDrive), a fully automated system for rendering route maps in the style of hand-drawn maps.3 LineDrive has been publicly accessible since October 2000, and surveys have shown that for navigation tasks users strongly prefer LineDrive maps to computer-generated maps drawn at a fixed scale (see Figure 5).
Researchers have also found that navigators familiar with a geographic area (such as cab drivers) plan routes hierarchically.4 They first select the highways necessary to get close to the destination, then the arteries, and finally the residential streets. Such hierarchical planning corresponds to the progressive increase in road detail we first identified in hand-designed destination maps. We recently applied this level-of-detail principle in conjunction with the distortion principles to build an automated system for generating destination maps.12 As in LineDrive, we produced a map that looks hand-drawn but that eliminates clutter while preserving the information necessary for anyone in the surrounding region to reach the destination. Our destination maps are available through the Bing Maps Web site (http://vis.berkeley.edu/DestMap) (see Figure 6).
We applied a similar approach to automatically generating maps for tourists visiting a new city.8 Prior work on mental representations of cities16 showed that people consider five main elements: landmarks, paths, districts, nodes, and edges. However, a map with every instance of such elements would be cluttered with excessive detail. The most-effective tourist maps include only those elements that are semantically meaningful (such as the home of a well-known writer), visually distinctive (such as an oddly shaped or colored building), or placed in a structurally important location (such as a building at a prominent intersection).22 After choosing the elements to include in the map, mapmakers usually apply a variety of cartographic-generalization techniques, including simplification, displacement, deformation, and selection. Cognitive psychologists and cartographers studying the cognition of maps have shown such generalizations improve clarity because they emphasize the most important map elements while preserving spatial relationships between these elements.17
Our tourist-map-design system is based on these design principles. Input consists of a geometric model of a city, including streets, bodies of water, parks, and buildings (with textures). The system automatically determines the importance of map elements using top-down Web-based information-extraction techniques to compute semantic importance and bottom-up vision-based image/geometry analysis to compute visual and structural importance. It then generates a map that emphasizes the most important map elements, using a combination of multi-perspective rendering and cartographic generalization to highlight the important landmarks, paths, districts, nodes, and edges while de-emphasizing less-important elements (see Figure 7).
Experiments on perception and cognition. In some domains, new perception and cognition research is required to provide the rationale for the design principles. Working with cognitive psychologist Barbara Tversky, we developed a methodology for conducting human-subject experiments to understand how people think about and communicate the information within a domain. We first applied this methodology to identify the design principles for creating assembly instructions for everyday objects (such as furniture and toys).2,9 The experiments are conducted in three phases:
Production. Participants create visualizations for a given domain. In the context of assembly instructions, they assembled a TV stand without instructions using only a photograph of the assembled stand as a guide. They then drew a set of instructions showing how to assemble it;
Preference. Participants rate the effectiveness of the visualizations. In the assembly-instructions project, a new set of participants assembled the TV stand, without instructions. They then rated the quality of the instructions created by the first set of participants, redrawn to control for clarity, legibility, and aesthetics; and
Comprehension. Participants use the ranked visualizations, and we test for improvements in learning, comprehension, and decision making. In the assembly-instructions project, yet another set of participants assembled the TV stand, this time using the instructions rated in the preference phase. Tests showed the highly rated instructions were easier to use and follow; participants spent less time assembling the TV stand and made fewer errors.
Following these experiments, we look for commonalities in the highly rated visualizations to identify the design principles. In the context of assembly instructions, we identified three main principles: (1) use a step-by-step sequence of diagrams showing one primary action in each diagram; (2) use guidelines and arrows to depict the actions required to fit parts together; and (3) ensure that the parts added in each step are visible. Our automated assembly-instruction-design system is based on these principles (see Figure 8). Tversky and Lee25 have studied mental representations of maps using a similar methodology, where subjects first draw maps to familiar locations, then other subjects rate the effectiveness of the maps.
Stage 2. Instantiate Design Principles
Designing a visualization usually requires choosing visual properties or attributes for each element in the display; for example, to create a route map, the designer must choose attributes, including position, size, and orientation for each road, landmark, and label that appears in the map. Similarly, to create a cutaway illustration, the designer must choose how and where to cut each structure that occludes the target part. Because there are many possible choices for each attribute, the design space of possible visualizations is usually quite large. To build automated visualization design systems, we treat the relevant design principles as guidelines for making these design decisions. The principles help us navigate through the design space and obtain an effective design.
Most design principles are stated as qualitative guidelines, rather than as procedures we can directly instantiate in an automated design algorithm. The challenge is to transform such high-level principles into implementable algorithms.
Design principles generally fall into two categories: design rules and evaluation criteria. Design rules separate the design space into regions containing effective designs and those containing inviable designs. They are essentially hard constraints in the design space. In creating route maps, for example, designers commonly adjust the turn angle to emphasize the orientation of the turn, to the left or to the right. However, adjusting the turn angle so much that a left turn appears to be a right turn or vice versa is unacceptable. This design rule puts a hard constraint on how much designers are able to adjust the turn angle.
Evaluation criteria quantify the effectiveness of some aspect of the visualization. We can assess the overall effectiveness of a visualization by considering a set of evaluation criteria covering all major aspects of the visual design. In creating an exploded view, for instance, designers must balance two such criteria: part separation and compactness. A good exploded view separates the parts so all of them are visible, yet the visualization must also remain compact and maintain a roughly square aspect ratio to make the best use of available screen space. To quantify the overall effectiveness of an exploded view we measure the visibility of each part, as well as the compactness of the overall visualization. Similarly, in designing route maps, designers must ensure that all roads are visible. To quantify this criterion, we compute the length of each road in the map and check the length is greater than some minimum visibility threshold. The number of roads longer than the threshold length is a quantitative measure of the effectiveness of the map with respect to this criterion.
These principles explain how visual techniques can be used to either emphasize important information or de-emphasize irrelevant details in the display.
Given a set of design rules and quantitative evaluation criteria, we can use procedural techniques to build an automated visualization design system; for example, our system for designing cutaways and exploded views is driven exclusively by procedural techniques. In this case, we encode the design rules as a decision tree describing how to cut or explode away occluding parts based on their geometry. Another approach is to consider visualization design as an energy-minimizing optimization problem. In this case, we treat the design rules as hard constraints that define the boundaries of the design space and the evaluation criteria as soft constraints that guide the system to the optimal visualization. While this optimization-based approach is general, we have found it essential to develop a set of design rules and evaluation criteria that sufficiently limit the design space so it is feasible to complete the optimization. Both LineDrive and our assembly-instruction design system use such an energy-minimizing optimization.
Stage 3. Evaluate Design Principles
The final stage of our approach is to measure the usefulness of the visualizations produced by our automated design systems. We consider several such measures, including feedback from users in the form of qualitative interviews and quantitative usage statistics. In some cases, we have also conducted more-formal user studies to check how well the visualizations improve information processing, communication, and decision making.
User feedback. We find it is critical to involve users early on and conduct qualitative interviews and surveys to check their overall impressions of the visualizations produced by our systems. Such feedback is essential for identifying problems and ensuring our design principles and the visualizations converge on effective designs. The interviews and surveys provide high-level checks of the effectiveness of our design principles and allow us to tweak the principles when not quite right; for example, early on building LineDrive, we asked users to rate handcrafted prototype route-map designs, finding that 79 out of 90 respondents preferred the distorted LineDrive prototypes to maps drawn to scale1 and confirming that users thought the distorted maps were useful. Continual feedback and evaluation yields more-effective algorithms and tools.
Another approach is to release the visualization on the Web, then check usage statistics; for example, at its peak, LineDrive was serving more than 750,000 maps per day and became the default route-mapping style for Map-Blast, an early Web-based provider of route maps. Such public feedback is a strong test of effectiveness, as ineffective solutions are quickly rejected. We also recognize that usage statistics are at best an indirect measure of effectiveness. Many excellent solutions remain little-used due to a variety of external forces that have little to do with the usefulness or effectiveness of a visualization.
User studies. To quantitatively assess the effectiveness of a visualization, we conduct user studies comparing visualizations created with our design algorithms to the best hand-designed visualizations in the domain; for example, we have compared our computer-designed instructions to factory-produced instructions and hand-drawn instructions for assembling a TV stand, finding that users completed the assembly task about 35% faster and made 50% fewer errors using our instructions. In addition to completion time and error rate, it is also possible to use eye-tracking to determine how a visualization affects the way people scan and process information.6,21 Such eye-tracking studies help us evaluate the effectiveness of low-level design choices in creating visualizations. Rigorous user studies are especially important because they also serve to validate the effectiveness of the design principles on which the visualizations are based.
Many other information domains could benefit from a deeper understanding of the ways visual-display techniques affect the perception and cognition of information.
However, how to design such quantitative studies is not always clear. How should one visualization be compared against another visualization? For example, in the domain of anatomical illustrations it is not clear how to compare our cutaway illustrations against hand-designed illustrations. What task should we ask users to perform using the two illustrations? One approach might be to measure how quickly and accurately viewers locate a particular organ of the body. However, if the task is to learn the location of the organ, then both illustrations would label the organ, and with labels, speed and accuracy are unlikely to differ significantly. Our cutaways and exploded views are also designed to convey the layering relationship between parts. So, an alternative task might be to ask viewers to indicate the layering relationships between parts. But how can we ask them to complete this task without leading them to an answer? For many domains, like anatomical illustrations, developing a new methodology is necessary for evaluating the effectiveness of visualizations and validating underlying design principles.
Conclusion
The approach we’ve outlined for identifying, instantiating, and evaluating design principles for visual communication is a general methodology for combining findings about human perception and cognition with automated design algorithms. The systems we’ve built for generating route maps, tourist maps, and technical illustrations demonstrate this methodology can be used to develop effective automated visualization-design systems. However, there is much room for extending our proposed approach, and we hope researchers improve on the methods we have described. Future work can take several directions:
Many other information domains could benefit from a deeper understanding of the ways visual-display techniques affect the perception and cognition of information. We commonly encounter a variety of different types of information, including cooking recipes, budgets and financial data, dance steps, tutorials on using software, explanations of strategies and plays in sports, and political polling numbers. Effective visualizations of such everyday information could empower citizens to make better decisions.
We have focused our work on identifying domain-specific design principles. An open challenge is to generalize them across multiple domains. One approach might be to first identify domain-specific design principles in very different domains, then look for commonalities between the domain-specific principles; for example, we recently developed an automated system for generating tutorials explaining how to manipulate photographs using Photoshop and GIMP.7 The design principles for photo-manipulation tutorials are similar to those we identified for assembly instructions and include step-by-step sequences of screenshots and highlighting actions through arrows and other diagrammatic elements. Finding such similarities in design principles across multiple domains may indicate more general principles are at work.
Though we presented three strategies for identifying design principles, other strategies may be possible as well. The strategies we presented all require significant human effort to identify commonalities in hand-designed visualizations, synthesize the relevant prior studies in perception and cognition, and conduct such studies. Moreover, the Internet makes a great deal of visual content publicly available, often with thousands of example visualizations within an individual information domain. Thus, a viable alternative strategy for identifying design principles may be to learn them from a large collection of examples using statistical machine-learning techniques. We have taken an initial step in this direction, with a project designed to learn how to label diagrams from a few examples.26 One advantage of this approach is that skilled designers often find it easier to create example visualizations than explicitly describe design principles.
Techniques for evaluating the effectiveness of visualizations and validating the design principles could also be improved. Design principles are essentially models that predict how visual techniques affect perception and cognition. However, as we noted, it is not always clear how to check the effectiveness of a visualization. More sophisticated evaluation methodology could provide stronger evidence for these models and thereby experimentally validate the design principles.
Acknowledgments
We would like to thank David Bargeron, Michael Cohen, Brian Curless, Pat Hanrahan, John Haymaker, Julie Heiser, Olga Karpenko, Jeff Klingner, Johannes Kopf, Niloy Mitra, Mark Pauly, Doantam Phan, Lincoln Ritter, David Salesin, Chris Stolte, Robert Sumner, Barbara Tversky, Dong-Ming Yan, and Yong-Liang Yang for their contributions to this research. Jeff Heer, Takeo Igarashi, and Tamara Munzner provided excellent suggestions and feedback on early drafts of this article. Figure 4a is from The New Way Things Work by David Macaulay: compilation copyright © 1988, 1998 Dorling Kindersley, Ltd., London; illustrations copyright © 1988, 1998 David Macaulay. Used by permission of Houghton Mifflin Harcourt Publishing Company. All rights reserved.
Figures
 Figure 1. Harry Beck’s map of the London Underground from 1933. Beck straightened the lines and more evenly spaced the stops to visually emphasize the sequence of stops along each line.
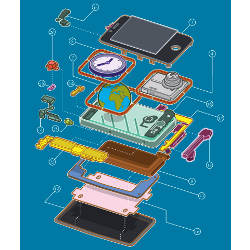
 Figure 2. Hand-designed cutaway and exploded-view illustrations (left) design the cuts and explosions to emphasize the shape of the missing geometry and spatial relationships among parts. Our system incorporates such principles to generate interactive cutaway and exploded-view illustrations (middle, right).
 Figure 3. Exploded views of complex mathematical surfaces are designed to reveal local geometric features (such as symmetries, self-intersections, and critical points).
 Figure 4. Hand-designed “how things work” illustrations (a) use motion arrows and frame sequences to convey the motion and interactions of the parts within a mechanical assembly. Our system analyzes a geometric model (b) of a mechanical assembly to infer the motion and interactions of the parts, then generates the motion arrows and frame sequences (c-d) necessary to depict how the assembly works.
 Figure 5. A computer-generated route map rendered at a fixed scale does not depict (left) all the turns necessary for navigation. A hand-designed map (middle) emphasizes the turning points by exaggerating the lengths of short roads and simplifying the shape of roads. Our LineDrive system incorporates these design principles (right) into an automated map-design algorithm.
 Figure 6. A general-purpose computer-generated map of San Francisco (left) is not an effective destination map because it is cluttered with extraneous information and neighborhood roads disappear. Our destination map (right) includes only the relevant highways, arterials, and residential roads required to reach a destination. The layout and rendering style further emphasize the information required to reach it.
 Figure 7. A hand-designed tourist map of San Francisco emphasizes semantically, visually, and structurally important landmarks, paths, districts, nodes, and edges, using multi-perspective rendering to ensure the facades of buildings are visible (left). Our tourist-map design system is based on these principles and similarly emphasizes the information most important for tourists in this map of San Francisco (right).
 Figure 8. We asked subjects to assemble a TV stand and then create instructions for a novice explaining how to assemble it (left, middle). Analyzing hand-drawn instructions, we found that diagrammatic, step-by-step instructions using guidelines and arrows to indicate the actions required for assembly and providing good visibility for the attached parts are easiest to use and follow. Our system automatically generates assembly instructions (right) based on these principles.


Join the Discussion (0)
Become a Member or Sign In to Post a Comment