
The high energy physics (HEP) group at California Institute of Technology started developing the MonALISA (Monitoring Agents using a Large Integrated Services Architecture) framework in 2002, aiming to provide a distributed service system capable of controlling and optimizing large-scale, data-intensive applications.11 Its initial target field of applications is the grid systems and the networks supporting data processing and analysis for HEP collaborations. Our strategy in trying to satisfy the demands of data-intensive applications was to move to more synergetic relationships between the applications, computing, and storage facilities and the network infrastructure.
An essential part of managing large-scale, distributed data-processing facilities is a monitoring system for computing facilities, storage, networks, and the very large number of applications running on these systems in near real time. The monitoring information gathered for all the subsystems is essential for developing the required higher-level services—the components that provide decision support and some degree of automated decisions—and for maintaining and optimizing workflow in large-scale distributed systems. These management and global optimization functions are performed by higher-level agent-based services. Current applications of MonALISA’s higher-level services include optimized dynamic routing, control, and optimization for large-scale data transfers on dedicated circuits, data-transfer scheduling, distributed job scheduling, and automated management of remote services among a large set of grid facilities.
The initial design of the MonALISA system was inspired by the Jini architecture.10 MonALISA is designed as an ensemble of autonomous self-describing agent-based subsystems that are registered as dynamic services. These services are able to collaborate and cooperate in performing a wide range of distributed information-gathering and processing tasks.
The MonALISA architecture, schematically presented in Figure 1, is based on four layers of global services. The entire system is based on Java technology.9
The first layer is the lookup services (LUS) network that provides dynamic registration and discovery for all other services and agents. MonALISA services are able to discover each other in the distributed environment and to be discovered by interested clients. The registration uses a lease mechanism. If a service fails to renew its lease, it is removed from the LUS and a notification is sent to all the services or other applications that subscribed to such events.
The second layer of the MonALISA framework represents the network of MonALISA services. They provide the multithreaded execution engine that accommodates many monitoring modules and a variety of loosely coupled agents that analyze the collected information in real time. The framework also integrates a set of existing monitoring tools and procedures to collect parameters describing computational nodes, applications, and network performance. The collected information can be stored locally in databases. Dynamically loadable agents and filters are able to process information locally and communicate with other services or agents in order to perform global optimization tasks. A service in the MonALISA framework is a component that interacts autonomously with other services either through dynamic proxies or via agents that use self-describing protocols. By using the network of lookup services, a distributed services registry, and the discovery and notification mechanisms, the services are able to access each other seamlessly. The use of dynamic remote event subscription allows a service to register an interest in a selected set of event types, even in the absence of a notification provider at registration time.
Proxy services make up the third layer of the MonALISA framework. They provide an intelligent multiplexing of the information requested by the clients or other services and are used for reliable communication among agents. This layer can also be used for access-control enforcement to provide secure access to the collected information and the remote services management.
Higher-level services and clients access the collected information using the proxies’ layer. A location-aware, load-balancing mechanism is used to allocate these services dynamically to the best proxy service. The clients, other services, or agents can get real time or historical data by using a predicate mechanism for requesting or subscribing to selected measured values. These predicates are based on regular expressions to match the attribute description of the measured values that a client is interested in. They may also be used to impose additional conditions or constraints for selecting the values. The subscription requests create a dedicated priority queue for messages. The communication with the clients is served by a pool of threads. The allocated thread performs the matching tests for all the predicates submitted by a client with the monitoring values in the data flow. The same thread is responsible for sending the selected results back to the client as compressed serialized objects.
Having independent threads for clients allows sending the information they need in a fast and reliable way, avoiding the interference caused by communication errors that may occur with other clients. In case of communication problems, these threads will try to reestablish the connection or clean up the subscriptions for a client or service that is no longer active.
Communication Lessons
One of the most difficult parts in developing the MonALISA system was the communication mechanism for all these services in the wide area network. The system tries to establish and maintain reliable communication among services, using the ability to reconnect automatically or find alternative services in case of network or hardware problems. Although, the fashion of the time was to implement remote call protocols over XML and to use Web services, we decided to use a binary protocol especially to avoid the overhead of wrapping everything in a text-based protocol and because of the lack of remote notification except for a pull-based approach (the Oasis Web Services Notification14 appeared later and still used a pull-based approach in the first implementations). Although XML or Web services still make perfect sense for certain applications, they are not appropriate for large dynamic data.
Our strategy in trying to satisfy the demands of data-intensive applications was to move to more synergetic relationships between the applications, computing, and storage facilities and the network infrastructure.
Initially we used the Java RMI (remote method invocation) as the communication protocol between clients and services. It was an elegant solution and helped us in the beginning to develop the other components of the framework without focusing too much on the underlying communication protocol. As soon as we started deploying the monitoring service on more and more sites, however, we had to replace this approach for two main reasons. The first was security concerns for the computing centers within HEP and the difficulty opening ports in the firewalls of those centers for incoming TCP connections. In some cases even the outgoing connectivity had to be restricted to a few IP addresses and ports. This was in fact the main reason for developing the layer of proxy services, allowing all the other MonALISA services to communicate with each other even when running behind firewalls or local NAT (network address translation) environments.
The second reason we had to replace RMI was because of its relatively low performance and stability in WAN connections (see Figure 2). The main operating system used in the HEP community was and still is Linux, but different flavors of it—kernels and libraries—and, of course, under a heterogeneous administration. Java helped a lot, but we have experienced stalled sockets and poor network throughput because of the TCP stack implementation in the 2.4 kernels used at the time.
We tried to find the best balance between performance and time spent developing a custom protocol, so we still used the native Java serialization. Because of the initial aim to react in almost real time, we had to develop our keep-alive mechanism at the application level; we could not control and also had problems with the one at the kernel level. Implementing our own communication protocol over standard TCP sockets helped us to have a finer control in case of network I/O errors for quick and clean recovery. Although the TCP implementation5 has changed in the latest 2.6 kernels—and even though the default congestion protocol works reasonably well without any special settings—we still believe that, depending on the time constraints for the application, any remote call protocol will be an issue in WAN environments because of the intrinsic overhead combined with network latency.
At the other end, for the LAN communication between thousands of monitored entities and the local MonALISA service, we decided to take another approach: use a UDP (User Datagram Protocol)-based binary but highly portable protocol employing external data representation (XDR)15 for data encoding. This choice proved to be effective and allowed the service to collect more than 5,000 messages per second without any loss—TCP would not have scaled to receive data simultaneously from all the nodes in a large computing farm. The ApMon client library (available in Java, C, Perl, and Python) that we developed for this purpose became the preferred way of tracing remote jobs and nodes, as it could send not only user-specific data, but also process and machine monitoring information.
Challenges of a Large, Data-Intensive Scientific Project
One of the largest communities using the MonALISA system is ALICE (A Large Ion Collider Experiment),1 one of four LHC (Large Hadron Collider) experiments at CERN (European Organization for Nuclear Research).4 The ALICE collaboration, consisting of more than 1,000 members from 29 countries and 86 institutes, is strongly dependent on a distributed computing environment to perform its physics program. The ALICE experiment will start running this year and will collect data at a rate of up to four petabytes per year. During its design lifetime of 20 years, ALICE will produce more than 109 data files per year, and require tens of thousands of CPUs to process and analyze them. The CPU and storage capacities are distributed over more than 80 computing centers worldwide. These resources are heterogeneous in all aspects, from CPU model and count to operating system and batch queuing software. The allocated resources should increase over time to match the increase in the data-acquisition rate resulting from changes in experiment parameters, so that a doubling is foreseen in two years, and so on.
The ALICE computing model requires a dedicated node in each computing center that runs the management software for the local resources. The same node is also running a MonALISA service that collects monitoring information from all computing nodes, storage systems, data-transfer applications, and software running in the local cluster. This yields more than 1.1 million parameters published in MonALISA, each with an update frequency of one minute. Moreover, ALICE-specific filters aggregate the raw parameters to produce system-overview parameters in realtime. These higher-level values are usually collected, stored, and displayed in the central MonALISA Repository for ALICE12 (see Figure 3) and are the fuel for taking automatic actions.
In this particular case we have managed to reduce the data volume to only about 35,000 parameters by aggregating, for example, the entire CPU usage by all the jobs in the local cluster in a single parameter, by summing up network traffic on all machines, and so on. These overviews are usually enough to identify problems and take global actions in the system, and they can be stored in a central database for longterm archival and analysis. The details are available on demand on the originating site and can be consulted with the GUI client. This approach proved to be very useful for debugging purposes—for example, to track the behavior of a particular application or host.
The ALICE computing model matched closely with MonALISA’s architecture so the pieces fit naturally together, but it also provided us big opportunity to fulfill the project’s initial goal: using the monitoring data to improve the observed system. Indeed, the actions framework implemented within MonALISA represents the first step toward the automation of decisions that can be made based on the monitoring information. It is worth noting that actions can be used in two key points: locally, close to the data source (in the MonALISA service) where simple actions can be taken; and globally, in a MonALISA client where the logic for triggering the action can be more sophisticated, as it can depend on several flows of data. Hence, the central client is equipped with several decisionmaking agents that help in operating this complex system: restarting remote services when they don’t pass the functional tests, sending e-mail alerts or instant messages when automatic restart procedures do not fix the problems, coordinating network-bandwidth tests between pairs of remote sites, managing the DNS-based load balancing of the central machines, and automatically executing standard applications when CPU resources are idle.
The actions framework has become a key component of the ALICE grid. Apart from monitoring the state of the various grid components and alerting the appropriate people to any problems that occur during the operation, this framework is also used to automate the processes. One such automation takes care of generating Monte Carlo data that simulates the experiment’s behavior or analyzes the data. In normal cases jobs run for 10 to 12 hours and generate or analyze files on the order of 10GB each. ALICE jobs, however, can fail for a number of reasons: among the most frequent are network issues and local machine, storage, or central services problems. By continuously monitoring the central task queue for production jobs, the MonALISA repository takes action when the number of waiting jobs goes below the preset threshold (4,000 jobs at the moment). First, it looks to see whether any failed jobs can be rescheduled to run; then if the queue length is still too short, it will schedule new bunches of 1,000 jobs. The same framework is used to copy data automatically to remote sites and to test the network connectivity among all endpoints. Combining the continuous testing of network and storages with error reporting has proved to be an efficient tool in debugging the system.
Having so many parameters to store and display on demand in a reasonably short time was a challenge—made even more difficult because the charts are generated on the fly based on users’ options. Database response time depends on the number of values, so one step toward generating charts on demand was storing averaged values over increasing time intervals, saving space but losing resolution. Three database structures are filled in parallel: from one with high resolution that keeps data only for the last couple of months to one with very low resolution that keeps data forever. The data controller automatically selects which portions of data to extract from which structure to meet user requests, and it can fetch data from more than one structure if the request parameters demand it.
The second step to reduce the response time was spreading the queries to more than one database back end. Three identical database instances now receive all the updates while the select queries are split so that different parameters are fetched in parallel from all active back ends. Having these two options in place allows serving some 20,000 dynamic pages per day from a single front-end machine while the database size has reached 170GB.
Data-Transfer Services and Optimized Communication
To support large-scale data-driven applications, such as those specific to the HEP community—particularly as the amount of data becomes more prevalent—a large set of subsystems has to be configured and tuned simultaneously. Performing these operations manually not only demands expensive human expertise, but also limits the maximum practical size of such a system. Also, it becomes difficult to deal with dynamically changing conditions and errors and to coordinate the resource requirements of different applications. Within the MonALISA framework, we developed a large set of modules and agents able to monitor different network devices, the network topology, and connectivity, and we tried to use this information in near real time to optimize the communication and data transfer in the WAN. This framework has been used for the past three years to monitor and coordinate large data transfers; we made demonstrations of the entire system at the Supercomputing conference in 2006,8 2007,2 and 2008.3
It is fair to say that at the beginning of this project we underestimated some of the potential problems in developing a large distributed system in WAN, and indeed the “eight fallacies of distributed computing” are very important lessons.
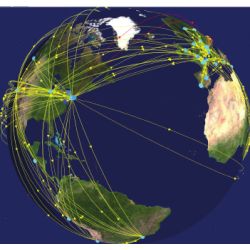
One example of such a system is the optimization of the global connectivity for the EVO collaboration network’s videoconferencing system.6 The optimization is based on continuous end-to-end monitoring, including the end user’s computer, as well as the network infrastructure. This way the user is informed of any potential or arising problems (for example, excessive CPU load or packet loss), and when possible, the problems are resolved automatically and transparently on the user’s behalf (for example, switching to another server node in the network, reducing the number of received video streams, among others). The EVO servers communicate with each other through a set of channels—secure TCP connections—that form an overlay network on top of the actual network topology. Dedicated MonALISA services are used to collect the monitoring data from all the EVO servers and to maintain the connectivity tree (minimum spanning tree) that connects the reflectors. This tree is used to compute the optimal routes for the videoconferencing data streams dynamically, based on information about the quality of alternative possible connections between each pair of reflectors. If one or more links goes down or is substantially degraded, the tree is rebuilt and reoptimized in real time, making EVO resistant to failures (see Figure 4).
A second example in which we used MonALISA was for monitoring and controlling optical switches and providing a global service to create on-demand optical paths/trees for end-user applications.13 The agents use MonALISA’s discovery layer to “discover” each other and then communicate among themselves autonomously, using the proxy services. Each proxy service can handle more than 15,000 messages per second, and several such services are typically used in parallel. This ensures that communication among the agents is highly reliable, even at very high message-passing rates.
The set of agents is also used to create a global path or tree, as it knows the state and performance of each local and wide area network link, and the state of the cross connections in each switch. The routing algorithm provides global optimization by considering the “cost” of each link or cross-connect. This makes the optimization algorithm capable of being adapted to handle various policies on priorities and prereservation schemes. The time to determine and construct an optical path (or a multicast tree) end to end is typically less than one second, independent of the number of links along the path and the overall length of the path. If network errors are detected, an alternative path is set up rapidly enough to avoid a TCP timeout, so that data transport continues uninterrupted.
The most laborious part of developing such global services that try to control the connectivity in the WAN is the handling of communication errors. Parts of our environment are in hybrid networks—some in research or dedicated networks only and some reachable from both academic and commercial networks. Most of the time everything works as expected and problems do not occur very frequently. When they do occur, however, it is important to understand what’s happening before acting upon it. In particular, we would like to discuss two possible cases of asymmetry in the system. When this happens only at the routing level, both sides involved in communication can reach each other, but by using different routes—this impacts the throughput and reliability of the communication, is not hard to detect, and is usually easy to recover from.
Another more serious problem occurs when different parts of the distributed framework involved in decisions have different views of the system. We had a case where some services in Europe could not reach the services in the U.S., while at the same time, some of them could see all the others. When you have a partial but consistent view of the system, you can act locally, but in this case we reached the conclusion that the best approach was to stay on the safe side and not make any decisions. Such problems do not occur frequently in our environment, but it is really difficult to detect them and avoid making wrong decisions for the types of systems we described.
Conclusion
During the past seven years we have been developing a monitoring platform that provides the functionality to acquire, process, analyze, and create hierarchical structures for information on the fly in a large distributed environment. The system is based on principles that allow for scalability and reliability together with easing communication among the distributed entities. This approach to collecting any type of monitoring information in such a flexible distributed framework can be used in further developments to help operate and efficiently use distributed computing facilities.
It is fair to say that at the beginning of this project we underestimated some of the potential problems in developing a large distributed system in WAN, and indeed the “eight fallacies of distributed computing” are very important lessons.7
The distributed architecture we used, without single points of failure, proved to offer a reliable distributed service system. In round-the-clock operation over the past five years we never had a breakdown of the entire system. Replicated major services in several academic centers successfully handled major network breakdowns and outages.
As of this writing, more than 350 MonALISA services are running around the clock throughout the world. These services monitor more than 20,000 compute servers, hundreds of WAN links, and tens of thousands of concurrent jobs. Over 1.5 million parameters are monitored in near real time with an aggregate update rate of approximately 25,000 parameters per second. Global MonALISA repositories are used by many communities to aggregate information from many sites, properly organize them for the users, and keep long-term histories. During the past year, the repository system served more than 8 million user requests.
![]() Related articles
Related articles
on queue.acm.org
Monitoring, at Your Service
Bill Hoffman
http://queue.acm.org/detail.cfm?id=1113335
Modern Performance Monitoring
Mark Purdy
http://queue.acm.org/detail.cfm?id=1117404
Web Services and IT Management
Pankaj Kumar
http://queue.acm.org/detail.cfm?id=1080876
Figures
 Figure 1. The four layers, main services, and components of the MonALISA framework.
 Figure 2. Monitoring the quality of WAN links.
 Figure 3. The MonALISA repository for ALICE. Lines represent site relations (Tier0-Tier1-Tier2).
 Figure 4. EVO overlay network topology—A Dynamic Minimum Spanning Tree.
From
![]()


Join the Discussion (0)
Become a Member or Sign In to Post a Comment