
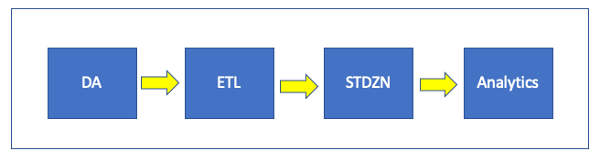
Explorys was a healthcare analytics startup that during its time had the largest clinical dataset in the United States. Explorys had dozens of healthcare organizations as customers and had onboarded over 400 data sources for its customers. For years, if anyone in the company was asked how the customer onboarding process worked, they would draw a diagram that looked roughly like this…
Credit: Doug Meil
… where:
- DA = Data Acquisition to integrate with source systems and extract required data, preferably in original form (or “raw”).
- ETL = Extract, Transform Load source data to the Explorys internal common model
- STDZN = Standardize many dozens of attributes with “local” values to standard codesets, taxonomies, and ontologies
- Analytics = Generate clinical measures and registries, some of them out-of-the-box offerings, and some custom per customer
The picture looks simple enough – bring in data, transform it, standardize it, and then analyze it. The problem was that issues had a habit of getting caught in the Analytics validation phase and frequently got ping-ponged back to the earlier steps in the process, and the ponging and pinging was amplified as the size of the implementation grew. The process generally worked, but it wasn’t entirely clear where the most expensive parts of the process were, and just as importantly why and what could be done about it.
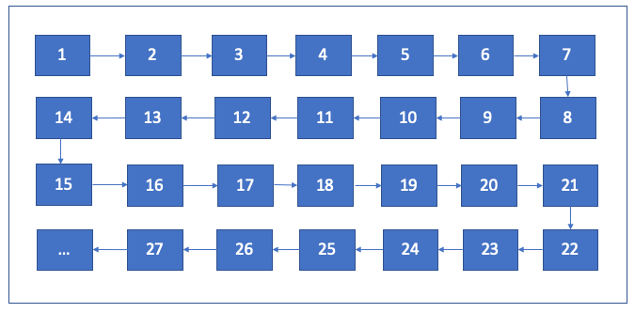
The Customer Services team put a process flow diagram together to document onboarding activities in detail. Such diagrams are important for understanding complex operations as they have a way of exposing steps that are often take for granted such as “Bob does XYZ.” Evaluating whether Bob is the only person who knows how to do XYZ is a good idea, and likewise whether XYZ is a manual step that deserves better tooling is another. The diagram was detailed with lots of boxes and lines…
Credit: Doug Meil
… and was incrementally useful but it still didn’t quite provide the clarity that people were looking for partly because such diagrams can have an anesthetizing effect at multi-page length. There had to be another dynamic at play.
Identifying Process Concurrency
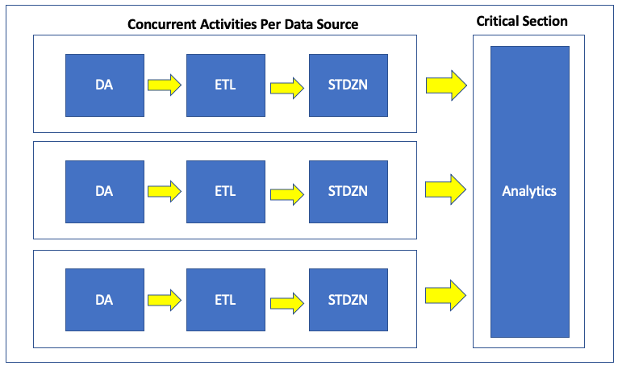
The engineering team eventually got more deeply involved in this process review, which arguably should have happened earlier but for some executive dynamics which complicated inter-team roadmap planning. I started drawing the process out myself, and then I realized what was missing in the discussions: the customer onboarding process wasn’t linear, at least not in the way that people drew it. The process really looked like this:
Credit: Doug Meil
The key was stepping back and internalizing the core value proposition of what Explorys did: for each healthcare customer Explorys would ingest multiple sources of data, construct combined patient records over those multiple sources, calculate a variety of analytics over these records, and have applications to view those results. And not just with one or two data sources, but 5, 10, 15 or more. One customer had over 30 sources. Plus, the sources almost never came in all at once. When a new data source was ingested, there were workstreams that could be performed and tested in isolation from all other data sources, such as the data integration (DA) and source-to-target data model transformations (ETL). However, cross data source analytics required a critical section because that is where all the data came together. Onboarding a new source meant that analytic results that had previously been viewed as stable could not only be changed but potentially invalidated.
While I can take credit for drawing the picture, I think just about every staff member involved in the customer onboarding process already knew the punchline but perhaps may not have been able to articulate it. People knew that the high level “DA -> ETL -> STDZN -> Analytics” explanation was sort of directionally correct but also incomplete in highly problematic way. But the simple understanding of the process hung around longer than it should have because it was easy to write on a whiteboard and put on a PowerPoint, especially for senior staff and executives. It was easier to yell at people to go faster and work harder than to come to terms with a complex process.
The Importance of Data Engineering
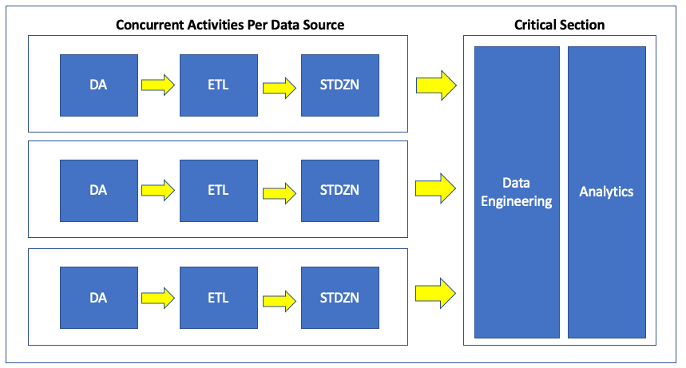
Not stated explicitly in the previous pictures was an underlying data engineering pipeline that would:
- Perform patient matching
- Based on configuration of patient matching algorithm itself, which was a probabilistic approach based on Fellegi & Sunter (1969).
- Includes the configured data sources for that customer.
- Construct combined patient record (or “chart”)
- Included the standardized attributes per data source, which were subject to fairly frequent changes.
- This step based on the output of patient matching.
- Generate derived record calculations
- Calculating derived records for the combined patient record, such as calculating a BMI (Body Mass Index) if there were height and weight measurements available, as well as performing supplementary data standardization for unit of measure conversions of Observations as needed.
- This step was based on the well as the rest of the combined patient chart, which was in turn based on patient matching.
- Risk model calculations
- Perform dozens of risk model calculations per combined patient.
- This step was based on the generated derived record calculations as well as the rest of the combined patient chart, which was in turn based on patient matching.
There was a lot going on under the hood. All of this data preparation went into the Analytics phase for clinical measure and registry calculations:
Credit: Doug Meil
Consequently, data issues from new or updated data sources could have a blast radius affecting the entire patient chart and downstream analytics. One small example from Explorys involved height and weight observations which looked suspect in a source from a particular customer but got loaded into production because the data is the data. But when processed at face value those values caused the BMI calculations to go way off scale, which in turn caused issues with multiple downstream clinical measures which included BMI calculations as criteria. As healthcare data is complex and not always clean, such cases are not unusual.
Managing Operational Data Quality
Having separating testing activities from production environments is a long-established best practice. Lower environments typically look like this:
- DEV – smaller environments testing all components of a solution (from integration to applications & reporting), but only for a subset of the data, and only periodically refreshed.
- QA – larger environments testing all components of a solution.
So far so good. But how large does QA need to be, and what about the data refresh rate? The devil is in the details. In the age of on-premise and statically provisioned infrastructure having a QA environment that was equivalent to Production was a rare luxury. Even in cloud-native solutions having a full-sized testing environment is something that should never be taken for granted. Similarly, having QA being an up-to-the-minute replica of Production (minus the data or analytics subject to testing and validation, of course) is another testing luxury. QA environment data has a tendency to trail by days, weeks, or sometimes months as it isn’t just about having the appropriate system capacity, there also needs to be automated processes to both rebuild the environments and sync the data. The more manual the processes, the longer the refresh cycles.
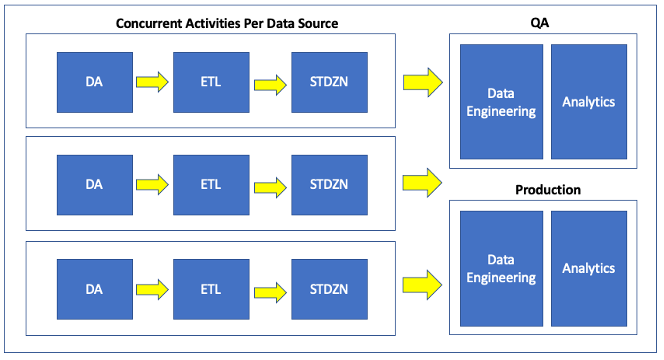
Image: Doug Meil
Code updates progressing through lower environments before being promoted to Production is to be expected. But does this apply to data? Does all data go to QA before Production? That is an idealized path but can be tough to pull off in real life for the reasons discussed above, plus that it also delays Production data updates. A compromise approach is to publish to QA first for significant data changes, such as a new data source that has not been ingested or processed before, or a major refactoring of an existing source. Segmenting QA into different sub-environments such as “QA-SystemTest” and “QA-Preproduction” are options but are really just different versions of the same problem.
Publishing data to Production doesn’t have to be a Damn the Torpedoes activity, however. Explorys built several safeguards in that environment where new sources could be published to the underlying datastore, but not included into the patient chart based on pipeline configurations. Also, there was a rolling retention window of all data engineering pipeline output for each customer such that in the event of data issues, the active version for a given customer could be set to yesterday instead of today, if required.
Finally
This post featured healthcare examples from Explorys with patient as one of the central analytic facts, but these ideas could apply to any domain replacing patient with customer, location, or anything else that is needed for cross data-source analysis. There is great power in such analytics – the challenge being validation and efficient operationalization of data pipeline processes. Particularly where the number sources are increasing, those sources are rapidly updating, and the analytics are ever-growing in complexity, this requires a cross-team and whole solution approach.
References
- BLOG@CACM
- What happened to Watson Health?
- For more on what happened to Explorys
- What happened to Watson Health?
- “Damn The Torpedoes”
- It’s not clear that Farragut actually said that, but it is a great quote.
- In 1864 torpedoes are what we would now refer to as mines.
Doug Meil is a software architect in healthcare data management and analytics. He also founded the Cleveland Big Data Meetup in 2010. More of his BLOG@CACM posts can be found at https://www.linkedin.com/pulse/publications-doug-meil


Join the Discussion (0)
Become a Member or Sign In to Post a Comment