
“Raise your hand if you don’t quite understand this whole financial crisis,” said David Leonhardt’s New York Times article, March 2008. The credit crisis had been going on for seven months and extensively and continuously covered by every major media outlet in the world. Despite that coverage, many readers felt they did not understand what it was about.
Key Insights
- Though human attention and comprehension can be overwhelmed by the data deluge, automatic methods can extract structured knowledge and provide maps of complex information landscapes to help people understand ideas, connections, and storylines.
- Properties of good maps are difficult to formalize; important characteristics include coherence of storylines, coverage of diverse and important topics, and relationships among pieces of information.
- These principles can be used to synthesize meaningful narratives from large datasets across multiple domains, including news stories, research papers, legal cases, and works of literature.
Paradoxically, pervasive media coverage may have contributed to the public’s lack of understanding, a phenomenon known as information overload. Recent technology advances allow us to produce data at bewildering rates, while the surge of the Web has brought down the barriers of distribution. Yet despite this accelerating data deluge, knowledge and attention remain precious and scarce commodities. Writers, researchers, and analysts spend countless hours gathering information and synthesizing meaningful narratives, examining and inferring relationships among pieces of information. Subtleties and relationships in an evolving story are easy to lose in an echo chamber created by the modification and reuse of content, as fueled by incentives to attract indexers, eyeballs, and clicks on advertisements. The problem of automatically extracting structured knowledge from large datasets is increasingly prevalent.
Several methods have sought to summarize and visualize narratives.2,28,29 However, most work only for simple stories that are linear in nature. In contrast, complex stories exhibit a nonlinear structure; stories spaghetti into branches, side stories, dead ends, and intertwining narratives. To explore them, users need a map to guide them through unfamiliar territory.
We previously introduced a methodology for creating structured summaries of information we call “metro maps.” The name is metaphoric; just as cartographic maps have been relied on for centuries to help us understand our surroundings, metro maps help us understand the information landscape. In this article, we explore methods we have developed for automatically creating metro maps of information.25–27
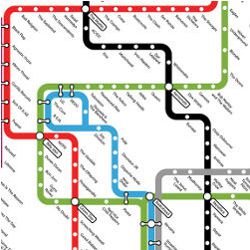
Metro maps consist of a set of lines with intersections or overlaps. Most important, they explicitly show the relationships among different pieces of information in a way that captures a story’s evolution. Each metro stop is a cluster of articles, and lines follow coherent narrative threads. Different lines focus on different aspects of the story; for example, the map in Figure 1 was automatically generated for the query “Crimea.” The map outlines the 2014 Crimean crisis, with the three lines corresponding to the Russian, Ukrainian, and Western points of view. The legend to the left of each line shows the important words for the line. The timeline appears at the bottom of the figure. The Russian (green) line starts in March, with the Crimea parliament voting to join Russia and Vladimir Putin recognizing Crimean independence. The Ukrainian (orange) line starts with Ukraine’s former prime minister urging the West to stop Russian aggression. The Ukrainian line then joins the Western (blue) line to discuss the West’s attempts to support Ukraine. Finally, the Russian and Ukrainian lines intersect when pro-Russia groups took over police stations in Ukraine.
Our representation is motivated by the strong empirical evidence that map representations help users gain and retain knowledge; for example, mind maps and knowledge maps have been shown to increase memory recall in students,11,23 as well as motivation and concentration.15 We have also found map visualizations enable users to digest information. We also integrated capabilities for supporting user interaction into the methodology, letting users guide formulation of the maps.
We demonstrate that metro maps can help people understand information in many areas, including news stories, research areas, legal cases, even works of literature. Metro maps can help them cope with information overload, framing a direction for research on automated extraction of information, as well as on new representations for summarizing and presenting complex sets of interrelated concepts.
Finding a Good Map
We start by formalizing the characteristics of good maps and formulating their construction as an optimization problem. We then provide efficient, scalable methods with theoretical guarantees for constructing maps. Our description of the characteristics is intentionally abstract. Later, we demonstrate how to adapt these abstract notions to various domains.
An objective function. Before we can come up with an algorithm for computing good maps, we must craft an objective function, which is especially important for maps, where the objective is not clear, a priori. In the following sections, we motivate and formalize several (sometimes conflicting) criteria. In the next section, we present a principled approach to constructing maps that optimizes trade-offs among these criteria.
First, recall our goal. Given a set of documents, we seek to compute a metro map that summarizes and organizes the documents. A metro map consists of a set of metro lines, each an ordered sequence of stops, where a stop is a subset of articles. Each line follows a coherent narrative thread, and different lines focus on different aspects of the story. Intersections across lines reveal the ways different storylines interact; for example, we computed the map in Figure 1 over news articles containing the word “Crimea” from March to April 2014. Each stop is a cluster of articles. The map includes three storylines, following the Russian, Ukrainian, and Western points of view.
Coherence. A first requirement is that each metro line tells a coherent story; following the articles along a line should give the user a clear understanding of the evolution of a story.
Consider a chain of clusters, where a cluster is a set of documents. For the sake of the presentation, we focus on singletons, with each cluster a single document. In order to define coherence, a natural first step is to measure similarity between each two consecutive articles along the chain. As a single bad transition can destroy the coherence of an entire chain, we measure the strength of the chain by the strength of its weakest link.
However, this simple approach can produce poor chains. Consider, for example, chains A and B. Both have the same endpoints, yet Chain A is significantly less coherent. Note the transitions of Chain A are all reasonable when examined out of context; the first two articles are about debt default, the second and third are about Republicans, and so on. Despite these local connections, the overall effect is incoherent.
Now take a closer look at the two chains. Figure 2 shows word appearance along both chains; for example, the word “Greece” appears throughout Chain B. It is easy to spot the associative flow of Chain A. Words appear for short stretches; some words appear, then disappear and reappear. Contrast this with Chain B, where stretches are longer and transitions are smoother. This observation motivates our definition of coherence.
We transform the problem into a linear programming optimization problem, where the goal is to choose a small set of words and score the chain based solely on these words. To ensure the strength of each transition, the score of a chain (given a set of active words) is the score of the weakest link; see Shahaf and Guestrin24 for details.
The score of a single link might depend on the domain. In Shahaf et al.26 we showed how to compute a score, given article content alone. In Shahaf et al.,25 we showed how to take advantage of links among articles.
Coverage. Coherence is crucial for good maps, but is it sufficient? Pursuing an answer, we found maximally coherent lines for the query “Bill Clinton.” The results were discouraging. While the lines were indeed coherent, they were not important. Many lines revolved around narrow topics (such as Clinton visiting Belfast). Moreover, as there was no notion of diversity, multiple lines included redundant information. This example suggests selecting the most coherent lines does not guarantee a good map. Instead, the key challenge is balancing coherence and coverage; in addition to being coherent, lines must also cover diverse topics important to the user.
We define a set of elements the map can cover. The elements can depend on the domain; in the case of news articles, we select words (such as “Obama” and “China”),26 so a high-coverage map discusses many important words. In the case of a scientific corpus, we select papers25 so a high-coverage map touches a large chunk of the corpus.
We calculate a coverage function, measuring how well each document covers each element. We extend it to a set function, measuring how well a set of documents covers each element. In order to encourage diversity, this function is submodular; if the map covers an element well already, adding another document covering that element well thus provides little extra coverage. Lack of extra coverage encourages us to pick documents that cover new topics instead.
We next introduce weights for each element, indicating the element’s importance. The weights bias the map toward covering important elements while also offering a natural mechanism for personalization. In Shahaf et al.,26 we discussed learning weights from user feedback, resulting in a personalized notion of coverage.
Connectivity. Finally, a map is more than a set of lines, with information in its structure as well. Our final property is thus connectivity. A map should convey the underlying structure of the story and how different aspects of the story interact.
Intuitively, different stories have different structures. Some stories are almost linear, while others are much more complex. In order to capture the structure of a story, we compute the minimum number of lines that cover all metro stops. This objective prefers long storylines whenever possible; linear stories become linear maps, while complex stories maintain their interweaving threads.
Tying it all together. We now formulate the problem of finding a good metro map, given a set of documents. We need to consider trade-offs among the properties discussed earlier: “cluster quality,” “line coherence,” “map structure,” and “coverage under budget”; for example, maximizing coverage leads to a disconnected map, as there is no reason to reuse a cluster for more than one line. Maximizing coherence often results in repetitive, narrow-scope chains. It is thus better to treat coherence as a constraint; a chain is either coherent enough to be included in the map, or it is not. Coverage and structure, on the other hand, should both be optimized. We define the map objective like this:
Problem 1 (Metro maps: Informal)
A map must satisfy
High coverage (o1)
High structure quality (o2)
Subject to
Minimal level of line coherence (c1)
Minimal cluster quality (c2)
Maximal map size (c3)
See Shahaf et al.27 for a formal statement of the algorithm and optimization.
Algorithm
We now briefly review the main ideas behind the algorithm, which starts by computing a set of documents from a query. We then segment the articles into time windows and compute good clusters for each window (constraint c2 in Problem 1) using a community-detection algorithm on word co-occurrence graphs.27 These clusters serve as metro stops.
Once we have clusters, we can proceed to computing coherent lines (constraint c1). Ideally, we could enumerate all possible candidate lines, but that is often infeasible. We instead propose a divide-and-conquer approach, constructing long lines from shorter ones. It allows us to compactly encode many candidate lines as a graph; the nodes of the graph correspond to short coherent lines, and edges indicate lines that can be concatenated and remain coherent. Paths in the graph thus correspond to coherent lines.
After encoding all coherent lines, we identify the underlying structure of the story, optimizing a connectivity objective (o2) that prefers longer storylines whenever possible. The objective, while difficult to optimize exactly, is submodular and can be efficiently approximated within guarantees.
A story may be very complex, but the user’s attention span is limited. To keep maps manageable, our final step is to restrict their size. We pick up to K lines that obey the structure and maximize coverage (c3 and o1). We rely on submodular optimization again to optimize the map within theoretical guarantees. Example outputs of the algorithm are in Figure 1 (Crimea) and Figure 3 (Boston).
Complexity and running time. Given a query set of documents D, we first run a linear-time algorithm, compiling D to a sequence of word co-occurrence graphs. More important, the size of the graphs does not depend on D but on the size of our vocabulary W. Our dependency on the size of D is linear, and our algorithm scales well (see Figure 4); see Shahaf et al.26 and Shahaf et al.27 for theoretical guarantees. Our main bottleneck is the coverage step, which is polynomial of a high degree in |W|. A parallel implementation and lazy evaluations achieve the same approximation guarantees while often leading to dramatic speedups.
The key challenge is balancing coherence and coverage; in addition to being coherent, lines must also cover diverse topics important to the user.
In practice, our system often takes less than a minute for query sets including tens of thousands of documents. Note while our system could in principle support even larger query sets, the use case we have in mind for maps rarely necessitates it. We speculate that very broad queries (“U.S.”) would be less common than narrower ones (“health care reform”).
Parameters. Tuning is required for several parameters to obtain a good metro map. In particular, each constraint in Problem 1 has an associated parameter that is manually adjusted on training queries. Another important parameter is m, the user’s “history window,” or number of previous articles in the line the user can remember. Higher m results in more coherent chains but is more computationally expensive. In practice, we choose the highest m we can afford computationally.
Applications
In the previous section, we discussed metro maps in the news domain, but maps are easily applied to other domains. The main principles—coherence, coverage, and connectivity—are the same, but one can use domain knowledge to improve the objective. In the following sections, we discuss four applications: news, science, legal documents, and books.
News. News media play a pivotal role informing the public of social, cultural, and political issues. Understanding news enables the public to make key life decisions (such as choosing a place to live or a political orientation). The consequences of acting without understanding the big picture can be adverse. However, with the increasing amount of content published every day, readers can easily miss the big picture amidst a flood of data.
Approach. We used our algorithms to compute maps about news events, assembling multiple news datasets covering hundreds of thousands of posts from Internet news sources; for a demonstration of the system see http://metromaps.stanford.edu/.
Evaluation. Quantitatively evaluating metro maps is difficult. There is no established gold standard for doing it, and ground truth is difficult to define. Since the goal of the maps is to help people navigate information, we conducted a user study to better understand the value of the methodology. The study took place in 2011 at Carnegie Mellon University in Pittsburgh, PA, aiming to test whether the maps we generate are useful for humans seeking information about complex topics.
To demonstrate a deep understanding of a topic, we asked users to explain it to others. We recruited 15 undergraduate students, asking them to write two paragraphs, one summarizing the Haiti earthquake and one summarizing the Greek debt crisis. We randomly assigned them a metro map or the Google News result page. We computed the maps from a corpus of more than 18,000 articles from the New York Times. We employed crowdworkers on Mechanical Turk (http://www.mturk.com/) to evaluate the paragraphs. In each round, we gave the crowdworkers two paragraphs (map user vs. Google News user) and asked them to assess which one provided a more complete and coherent picture of the story. After removing spam, we had 294 evaluations for Greece and 290 for Haiti; 72% of the Greece comparisons preferred map paragraphs, but only 59% of the Haiti comparisons preferred map paragraphs. After examining the Haiti paragraphs, we found most map users focused solely on the major storyline (on distributing aid). Based on the results of the study, we speculate maps are more useful for stories without a single dominant storyline.
Science. As the number of scientific publications soars, even the most enthusiastic reader can have trouble staying on top of the evolving literature. We are motivated by the idea of creating valuable literature exploration tools that can help people entering a new field (such as new graduate students or experts reaching beyond their traditional discipline’s borders).
Approach. We extended our techniques to the scientific domain, aiming to test whether maps can help researchers understand the state of the art of a field. We modified the objective slightly (see Shahaf et al.25), taking advantage of the citation graph. Our dataset included more than 35,000 papers from ACM conferences and journals.
Figure 5 outlines part of a map we computed for the query “reinforcement learning,” depicting multiple lines of research, including Markov decision processes, robotics and control, bounds and analysis, exploration-exploitation trade-offs, and multiagent cooperation. Note the lines in the figure do not intersect. Intersection in the scientific domain is difficult; a theory line and an application line can be highly related, yet no single document belongs to both. We thus modified our objective to allow for a softer kind of connectivity, where lines can interact through citations; for example, the map shows how the Markov Decision Process line affects the multi-agent and robotics lines and how the exploration-exploitation line interacts with the analysis line. These relationships are gray dashed paths, with relevant citation text nearby.
Maps are designed to display connections between multiple pieces of information.
Evaluation. To test our maps, we recruited 30 graduate students from Carnegie Mellon University, asking them to conduct a quick literature survey in reinforcement learning, an area they had not studied. In particular, we asked them to update a survey paper from 1996 by identifying up to five research directions that should be included in the updated survey and listing a few relevant papers for each direction. We recorded their browsing histories and took a snapshot of their progress every minute. We limited their time to 40 minutes to simulate a quick first pass on the papers. All participants used Google Scholar,a a search engine that indexes scholarly literature. In addition, we gave 15 of them a metro map. Allowing them to query Google Scholar’s entire set of publications makes the task both more realistic and more difficult for maps.
An expert graded the output of all participants. We wanted them to find good papers, as well as identify important research areas. We thus measured precision (fraction of retrieved papers that are relevant) and subtopic recall (fraction of relevant research areas retrieved). Map users outperformed Google-only users in every parameter, with an average score of 84.5%, discovering on average 1.62 seminal papers. Google users achieved a score of 74.2%, finding 1.2 seminal papers on average. The map users’ average recall score was 73.1%, compared to Google’s 46.4%.
Further analysis of the snapshots we took throughout the study provides anecdotal evidence of the map’s utility. Google users visited more pages and listed more papers on average. However, when looking at the average ratio, only one of 4.5 pages visited by Google users was added to their list, while map users added one of 3.8 pages. That is, the map users appeared to be more focused; they may have visited fewer pages but found them satisfactory. In addition, several map users started by composing a short list of research directions, then progressively added papers to each direction throughout the session. Google users, in contrast, did not exhibit such “big picture” behavior.
Legal documents. Law is built on the evolution of ideas with links to key precedents. Legal scholars and lawyers routinely do research on legal corpora, dealing with an avalanche of information. Despite the related informational challenges, legal documents and review processes remain largely untouched by technology. We sought to explore the value of metro maps to help lawyers argue a case, envisioning a system that would help them find related cases, understand how the law has evolved (and why it changed), and prepare a case strategy accordingly.
Approach. Our data consisted of U.S. Supreme Court decisions as supplied by Ravel Law.b Unlike news articles and scientific papers, Supreme Court decisions can be lengthy, reaching hundreds of pages. The simple text-processing methods of the earlier sections could not separate the wheat from the chaff for legal scholars.
Addressing this challenge, we focused on anchor text, or text surrounding citations. Identifying highly cited paragraphs allowed us to focus on the important parts of each case; for example, Women’s Community Health v. Cohen cites Roe v. Wade, saying, “[T]he Supreme Court held that the constitutional “right of privacy … is broad enough to encompass a woman’s decision whether or not to terminate her pregnancy” (Id. 410 U.S. at 153 93 S.Ct. at 727). We used the anchor text to compute our input set of documents and applied our map algorithm.
Evaluation. As a reality check, we computed a map for the query “commerce clause,” which appears in Article I, Section 8 of the U.S. Constitution, saying the Congress has power “To regulate Commerce with foreign Nations, and among the several States, and with the Indian Tribes.” It is an important clause that has been thoroughly discussed in multiple courts.
Figure 6 (left) shows the map we computed and shown to lawyers from Ravel Law, asking for their interpretation. They browsed through it and manually labeled each line. As a reality check, we then computed the words that made each line coherent for our algorithm. Figure 6 (right) shows the comparison. The coherent words correspond well to the lawyers’ annotation; for example, the purple line deals with the question of whether Congress may abrogate the Eleventh Amendment immunity of the states. This line was labeled “eleventh amendment, state sovereignty” by the lawyers, and its coherent words were “immunity,” “sovereignty,” “amendment,” and “eleventh.”
We further asked the lawyers to explain each line. As an example, consider again the purple line in Figure 6. The line starts with Ford Motor v. Dept. of Treasury. The Court held the Eleventh Amendment denies to the federal courts authority to entertain a suit by private parties against a state without the state’s consent.
In the next stop (a case known as Parden v. Terminal Railway), the Court discussed whether a state owning a railroad could successfully plead sovereign immunity in a federal court suit by its employees. In Employees v. Dept. of Public Health, the Court noted even if the Court reverses itself, Congress can provide authority for suits in state courts to implement federal statutory rights, thus doing away with common law sovereign immunity of the states. Next, in Quern v. Jordan, the Court held Congress had not intended to include states within the term “person” for the purpose of subjecting them to suit. Finally, in the last stop (a case known as Welch v. Texas Highways), the Court overruled an aspect of Parden regarding states participating in federal spending programs.
Likewise, the lawyers could explain all other lines, expressing their confidence in the benefit of maps to the legal community.
Books. Narratives are important in many areas, including literary criticism, political science, and linguistics. Despite it, we know little about their structure. We thus decided to apply metro maps to elucidate the structure of complex books. Our first test case was The Lord of the Rings, an epic fantasy novel of more than 480,000 words, internally divided into six books. It includes a long list of characters that can be difficult to follow for even the most dedicated reader.
Approach. Since our maps operate on a collection of documents, we partitioned the book into three-page segments, treating each segment as a document. Applying the maps algorithm to this collection of segments, we encountered an interesting problem with our notion of coherence, originally developed in the context of news. Journalists often remind their readers of previous events, and thus coherence could be inferred through repetition. In contrast, book authors do not recap events that happened several pages ago but rather rely on the memory of engaged readers. We therefore relied on other hints for coherence.
Noting a character’s point of view is often a coherent narrative, we thus decided to focus on named entities. We identified the characters present on each page and looked for storylines with co-occurring characters.
Evaluation. Figure 7 shows a segment from The Lord of the Rings map that reveals important structural information: The story begins in the Shire (leftmost cluster) where Gandalf meets the hobbits. In the pages associated with this cluster, Gandalf advises Frodo to take the ring away from the Shire. In the second cluster, Frodo leaves, accompanied by Sam, Merry, and Pippin. They take the Strider, later revealed to be Aragorn, as guide and protector.
In the next cluster, Aragorn leads the hobbits to Rivendell where the Council of Elrond meets. The Council decides the Ring must be destroyed, and a “Fellowship of the Ring” is formed, including Sam, Merry, Pippin, Aragorn, Gandalf, Gimli, Legolas, and Boromir.
The council cluster splits into three lines, as in Figure 7, corresponding to the fellowship splitting up when orcs kidnap Merry and Pippin (green line). Aragorn, Gimli, and Legolas pursue the orcs (purple line), while Frodo and Sam continue on their own, capturing Gollum (blue line), and head toward Mordor, the region controlled by Sauron and his servant, Saruman (yellow line).
This example, while preliminary, demonstrates the potential of maps for sorting through complex plotlines.
Using Maps
We have discussed the process of creating maps and now shift to the user, exploring possible uses of maps. We rely on the traditional information-retrieval framework, characterizing a user by an information need. Users formulate their information needs and submit queries to a system. If not satisfied with the results, they may interact with the system through reformulated queries until they are satisfied. In this section, we discuss information needs and interaction scenarios.
Information needs. Maps are not intended to replace search engines; many search-engine queries are extremely focused, and corresponding information needs are often satisfied with a simple phrase. In contrast, maps are designed to display connections between multiple pieces of information. In terms of Broder’s taxonomy,7 maps are mostly useful for informational queries, and of little use for navigational and transactional queries.
We would like to characterize the information needs of map users. Informational queries are driven by a user’s need to learn something. In order to characterize the different types of learning, we rely on Bloom’s taxonomy,3 which identifies six cognitive categories characterizing the processes of learning, from recalling facts to making judgments.
We distinguish between two categories of information needs for map users. “Learn” corresponds to the lower three levels of Bloom’s taxonomy; the user’s goal is to acquire knowledge. A user in the learn category might be interested in surveying a concrete topic, which may be new to the user or a familiar one the user wishes to monitor. Alternatively, the user may wish to explore and navigate around a starting point. Navigation is a promising application for maps, with many news sites today including a “related articles” function. Maps can augment it, allowing users to see the article in a broader context. Note the learn category does not include fact lookup or question answering. As described in Shahaf et al.,26 maps are less useful for this type of query.
The “investigate” category corresponds to the higher levels of Bloom’s taxonomy, where users aim to produce outcomes. In it, users aim to transform existing data into useful patterns, seeking gaps in current knowledge. They analyze and synthesize different pieces of information, looking for plausible generalizations that could result in new insights. In particular, such users might be interested in contrasting and comparing multiple maps.
Interaction. Interaction is crucial to the success of metro maps. Users often know precisely what they want to find, but it is not easy for them to distill their ideas into a few keywords. Maps should thus allow interaction. Many models of interaction can be naturally integrated with metro maps. We rely on user feedback to learn preferences and adjust our maps accordingly. In the following sections, we discuss two interaction mechanisms we have implemented: “zooming” and “word feedback.”
Zooming. Some users are interested in a quick, high-level overview of a topic, while others wish to delve into the details. We thus want our maps to be zoomable. As maps are richly expressive, there are multiple ways to interpret zoom interactions. We have implemented three interpretations: zooming could affect time resolution; cluster resolution could make clusters split and merge; and users could focus on a particular metro line.
Word feedback. When a user interacts with a map, the map should ideally support feedback of the form “Tell me more about the E.U.’s reaction to the crisis” or “I am not interested in the Red Sox.” Labeling entire maps, or even single documents, is not rich enough to support this interaction model. Also, there is no way to indicate a user likes something not on the map.
We propose “feature-based feedback” instead to provide a natural way to support the queries discussed earlier; the user could increase the importance of the word “E.U.” and decrease the importance of “baseball” to achieve the desired effect. We use a discriminative semi-supervised learning method that incorporates such training affinities between features and classes.9 Using it, we define a personalized, session-sensitive notion of coverage that accounts for user feedback.
Related Work
To the best of our knowledge, automatic construction of metro maps is novel. Nevertheless, extensive work has been done on myriad related directions, from topic detection and tracking to summarization and temporal text mining.
Given a query, our algorithms generate concise structured sets of storylines that maximize coverage of salient pieces of information.
Our work differs from previous work in several important ways. First, our system has structured output, so not only does it pick nuggets of information, it explicitly shows connections among them. Prior work was limited largely to list-output models. In the summarization task,2,20,22 the goal is often to summarize a corpus of texts by extracting a list of sentences. Other methods18,31,30 discover new events but do not attempt to string them together.
Numerous efforts at information retrieval go beyond lists to provide richer views, including different notions of storylines.1,2,28,29 Graph representations are common across a variety of related problems,10,14,17,19 from topic evolution to news analysis. However, in all these methods there is no notion of graph paths as coherent storylines. Rather, graph edges might be selected because they pass a threshold or belong to a spanning tree.
Still other methods5,6 consider coherence at the path-level, in the sense that they aggregate a similarity score across all chain documents. However, they do not consider the order of the documents or the strength of the weakest link and may assign high coherence to chains despite bad transitions. Guaranteeing strong transitions across chains facilitates knowledge acquisition and comprehension.
Multiple tools exist for summarizing and visualizing literature; see Borner4 for a compendium. Unlike our clusters of documents, many of these systems12,16 use a single concept as a unit of analysis. This granularity is too fine to be useful by a non-expert. Other tools with granularity similar to ours often focus on visualizing citations or co-citations.8,13 Again, edges between documents are based on local computation, and there is no notion of coherent lines of research.
Finally, visual metaphors similar to metro maps have been used before to display abstract knowledge; for example, Nesbitt’s map shows interconnecting ideas running through his Ph.D. thesis.21 However, these maps were all constructed manually, as opposed to ours being generated automatically.
Conclusion
We have outlined our studies to date on methods that extract information and construct summarizing metro maps. Given a query, our algorithms generate concise structured sets of storylines that maximize coverage of salient pieces of information. Most important, metro maps explicitly show the relationships between lines. We have applied metro maps to help people understand news stories, research areas, legal cases, and works of literature. We conducted promising pilot user studies over real-world datasets in several domains. The results suggest metro maps help users acquire knowledge more efficiently.
Our work also has several limitations that would be interesting to address in the future; for example, our notion of coherence assumes word repetition, so our system cannot handle extremely short documents (such as Twitter posts). Moreover, our shallow features make coherence metrics prefer chains of articles from the same source. We also plan to make our system more robust to noise; while the method is not very sensitive to the removal of a few articles from the dataset, near-duplicates affect coverage weights, biasing the algorithm toward covering them. Sensitivity to small changes in the query date range might be addressed by automatically finding an optimal segmentation of the timeline.
We also plan to experiment with richer forms of input, output, and interaction mechanisms and integrate higher-level semantic features. Much of the current work was devoted to crafting an objective function; in the future, we wish to learn or revise an objective function directly from user feedback. Another interesting direction is the point-of-view mechanism, letting users see a topic through the eyes of another person (such as a Democrat asking for the Republican point of view).
This line of work can lead to tools that help people navigate and understand ideas, trends, connections, and storylines amidst an information explosion.
Acknowledgments
We would like to thank Rok Sosic, Andrej Krevl, Dima Brezhnev, Caroline Suen, Jeff Jacobs, Heidi Wang, Thomas von der Ohe, Tom Camenzind, Rohan Puttagunta, and Raiyan Khan. This research has been supported in part by NSF IIS-1016909, CNS-1010921, IIS-1149837, DARPA SMISC, DARPA GRAPHS, ARL AHPCRC, Okawa Foundation, Docomo, Boeing, Volkswagen, Intel, the Brown Institute for Media Innovation, and the Alfred P. Sloan Fellowship.
Figures
 Figure 1. Sample output: metro map of the 2014 Crimean crisis.
 Figure 2. Word patterns in Chain A (left) and B (right); bars correspond to word appearance in the articles listed above.
 Figure 3. A metro map for the query “Boston” in May 2013.
 Figure 4. Overview of the algorithm. We compute clusters, encode coherent lines in a graph, and use the graph to compute the structure of the story. We then pick K lines from the structure that maximize coverage.
 Figure 5. Part of the map computed for the query “reinforcement learning.”
 Figure 6. Detail of a map over legal documents for the query “Commerce Clause.”
 Figure 7. Detail from The Lord of the Rings map revealing the structure of the story; one can see how hobbits and Gandalf start their journey, gather together in Elrond’s council, and then split up, with callout bubbles as manual annotations.
 Figure. Watch the authors discuss their work in this exclusive Communications video. http://cacm.acm.org/videos/information-cartography


Join the Discussion (0)
Become a Member or Sign In to Post a Comment