Code-completion systems offering suggestions to a developer in their integrated development environment (IDE) have become the most frequently used kind of programmer assistance.1 When generating whole snippets of code, they typically use a large language model (LLM) to predict what the user might type next (the completion) from the context of what they are working on at the moment (the prompt).2 This system allows for completions at any position in the code, often spanning multiple lines at once.
Key Insights
AI pair-programming tools such as GitHub Copilot have a big impact on developer productivity. This holds for developers of all skill levels, with junior developers seeing the largest gains.
The reported benefits of receiving AI suggestions while coding span the full range of typically investigated aspects of productivity, such as task time, product quality, cognitive load, enjoyment, and learning.
Perceived productivity gains are reflected in objective measurements of developer activity.
While suggestion correctness is important, the driving factor for these improvements appears to be not correctness as such, but whether the suggestions are useful as a starting point for further development.
Potential benefits of generating large sections of code automatically are huge, but evaluating these systems is challenging. Offline evaluation, where the system is shown a partial snippet of code and then asked to complete it, is difficult not least because for longer completions there are many acceptable alternatives and no straightforward mechanism for labeling them automatically.5 An additional step taken by some researchers3,21,29 is to use online evaluation and track the frequency of real users accepting suggestions, assuming that the more contributions a system makes to the developer’s code, the higher its benefit. The validity of this assumption is not obvious when considering issues such as whether two short completions are more valuable than one long one, or whether reviewing suggestions can be detrimental to programming flow.
Code completion in IDEs using language models was first proposed in Hindle et al.,9 and today neural synthesis tools such as GitHub Copilot, CodeWhisperer, and TabNine suggest code snippets within an IDE with the explicitly stated intention to increase a user’s productivity. Developer productivity has many aspects, and a recent study has shown that tools like these are helpful in ways that are only partially reflected by measures such as completion times for standardized tasks.23,a Alternatively, we can leverage the developers themselves as expert assessors of their own productivity. This meshes well with current thinking in software engineering research suggesting measuring productivity on multiple dimensions and using self-reported data.6 Thus we focus on studying perceived productivity.
Here, we investigate whether usage measurements of developer interactions with GitHub Copilot can predict perceived productivity as reported by developers. We analyze survey responses from developers using GitHub Copilot and match their responses to measurements collected from the IDE. We consider acceptance counts and more detailed measures of contribution, such as the amount of code contributed by GitHub Copilot and persistence of accepted completions in the code. We find that acceptance rate of shown suggestions is a better predictor of perceived productivity than the alternative measures. We also find that acceptance rate varies significantly over our developer population as well as over time, and present a deeper dive into some of these variations.
Our results support the principle that acceptance rate can be used for coarse-grained monitoring of the performance of a neural code synthesis system. This ratio of shown suggestions being accepted correlates better than more detailed measures of contribution. However, other approaches remain necessary for fine-grained investigation due to the many human factors involved.
Background
Offline evaluation of code completion can have shortcomings even in tractable circumstances where completions can be labeled for correctness. For example, a study of completions by 66 developers in Visual Studio found significant differences between synthetic benchmarks used for model evaluation and real-world usage.7 The evaluation of context-aware API completion for Visual Studio IntelliCode considered Recall@5—the proportion of completions for which the correct method call was in the top five suggestions. This metric fell from in offline evaluation to when used online.21
Offline evaluation of code completion can have shortcomings even in tractable circumstances.
Due to the diversity of potential solutions to a multi-line completion task, researchers have used software testing to evaluate the behavior of completions. Competitive programming sites have been used as a source of such data8,11 as well as handwritten programming problems.5 Yet, it is unclear how well performance on programming competition data generalizes to interactive development in an IDE.
It is unclear how well performance on programming competition data generalizes to interactive development in an IDE.
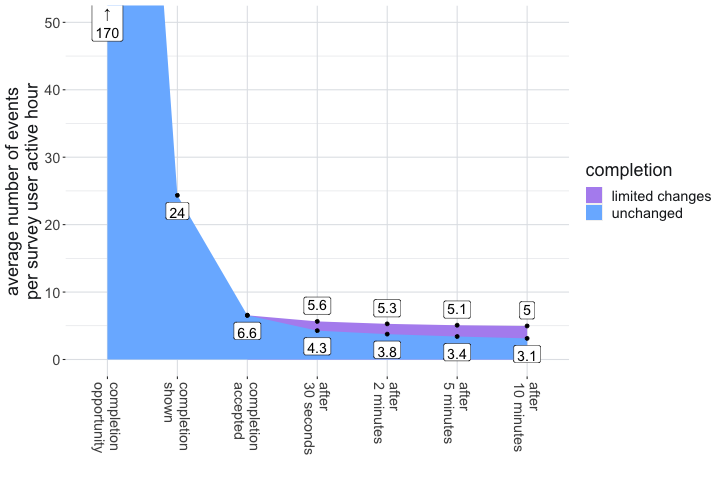
In this work, we define acceptance rate as the fraction of completions shown to the developer that are subsequently accepted for inclusion in the source file. The IntelliCode Compose system uses the term click through rate (CTR) for this and reports a value of in online trials.20 An alternative measure is that of daily completions accepted per user (DCPU) for which a value of around 20 has been reported.3,29 To calculate acceptance rate one must, of course, normalize DCPU by the time spent coding each day. For context, in our study GitHub Copilot has an acceptance rate of and a mean DCPU in excess of 312 (See Figure 1).b These differences are presumably due to differences in the kinds of completion offered, or perhaps to user-interface choices. We discuss later how developer objectives, choice of programming language, and even time of day seem to affect our data. Such discrepancies highlight the difficulty in using acceptance rate to understand the value of a system.
There is some evidence that acceptance rate (and indeed correctness) might not tell the whole story. One survey of developers considered the use of AI to support translation between programming languages and found indications that developers tolerated, and in some cases valued, erroneous suggestions from the model.26
There is some evidence that acceptance rate (and indeed correctness) might not tell the whole story.
Measuring developer productivity through activity counts over time (a typical definition of productivity borrowed from economics) disregards the complexity of software development as they account for only a subset of developer outputs. A more holistic picture is formed by measuring perceived productivity through self-reported data across various dimensions6 and supplementing it with automatically measured data.4 We used the SPACE framework6 to design a survey that captures self-reported productivity and paired the self-reported data with usage telemetry.
To the best of our knowledge, this is the first study of code suggestion tools establishing a clear link between usage measurements and developer productivity or happiness. A previous study comparing GitHub Copilot against IntelliCode with 25 participants found no significant correlation between task completion times and survey responses.22
Data and Methodology
Usage measurements.
GitHub Copilot provides code completions using OpenAI language models. It runs within the IDE and at appropriate points sends a completion request to a cloud-hosted instance of the neural model. GitHub Copilot can generate completions at arbitrary points in code rather than, for example, only being triggered when a developer types a period for invoking a method on an object. A variety of rules determine when to request a completion, when to abandon requests if the developer has moved on before the model is ready with a completion, and how much of the response from the model to surface as a completion.
As stated in our terms of usage,c the GitHub Copilot IDE extension records the events shown in Table 1 for all users. We make usage measurements for each developer by counting those events.
opportunity | A heuristic-based determination by the IDE and the plug-in that a completion might be appropriate at this point in the code (for example, the cursor is not in the middle of a word) |
shown | Completion shown to the developer |
accepted | Completion accepted by the developer for inclusion in the source file |
accepted_char | The number of characters in an accepted completion |
mostly_unchanged_X | Completion persisting in source code with limited modifications (Levenshtein distance less than 33%) after X seconds, where we consider durations of 30, 120, 300, and 600 seconds |
unchanged_X | Completion persisting in source code unmodified after X seconds. |
(active) hour | An hour during which the developer was using their IDE with the plug-in active |
Our measures of persistence go further than existing work, which stops at acceptance. The intuition here is that a completion which is accepted into the source file but then subsequently turns out to be incorrect can be considered to have wasted developer time both in reviewing it and then having to go back and delete it. We also record mostly unchanged completions: A large completion requiring a few edits might still be a positive contribution. It is not clear how long after acceptance one should confirm persistence, so we consider a range of options.
The events pertaining to completions form a funnel which we show quantitatively in Table 1. We include a summary of all data in Appendix A.d (All appendices for this article can be found online at https://dl.acm.org/doi/10.1145/3633453).
We normalize these measures against each other and write X_per_Y to indicate we have normalized metric X by metric Y. For example: accepted_per_hour is calculated as the total number of accepted events divided by the total number of (active) hour events.
Table 2 defines the core set of metrics which we feel have a natural interpretation in this context. We note that there are other alternatives and we incorporate these in our discussion where relevant.
| Natural name | Explanation |
|---|---|
| Shown rate | Ratio of completion opportunities that resulted in a completion being shown to the user |
| Acceptance rate | Ratio of shown completions accepted by the user |
| Persistence rate | Ratio of accepted completions unchanged after 30, 120, 300, and 600 seconds |
| Fuzzy persistence rate | Ratio of accepted completions mostly unchanged after 30, 120, 300, and 600 seconds |
| Efficiency | Ratio of completion opportunities that resulted in a completion accepted and unchanged after 30, 120, 300, and 600 seconds |
| Contribution speed | Number of characters in accepted completions per distinct, active hour |
| Acceptance frequency | Number of accepted completions per distinct, active hour |
| Persistence frequency | Number of unchanged completions per distinct, active hour |
| Total volume | Total number of completions shown to the user |
| Loquaciousness | Number of shown completions per distinct, active hour |
| Eagerness | Number of shown completions per opportunity |
Productivity survey.
To understand users’ experience with GitHub Copilot, we emailed a link to an online survey to users. These were participants of the unpaid technical preview using GitHub Copilot with their everyday programming tasks. The only selection criterion was having previously opted in to receive communications. A vast majority of survey users (more than 80%) filled out the survey within the first two days, on or before February 12, 2022. We therefore focus on data from the four-week period leading up to this point (“the study period”). We received a total of 2,047 responses we could match to usage data from the study period, the earliest on Feb. 10, 2022 and the latest on Mar. 6, 2022.
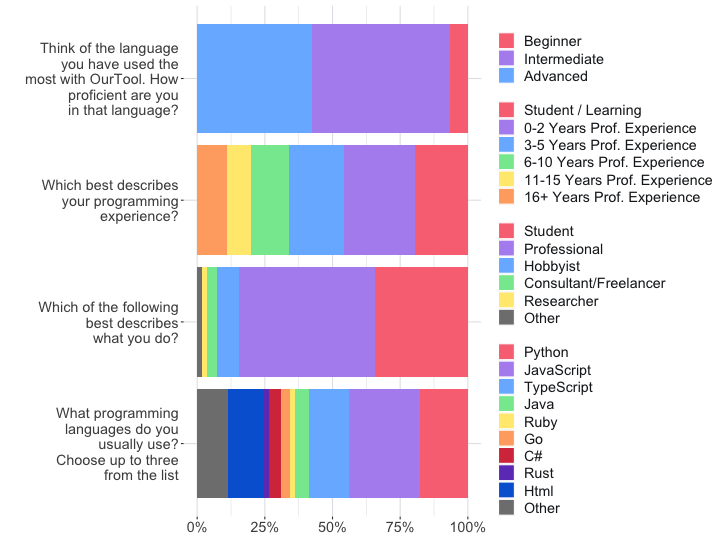
The survey contained multiple-choice questions regarding demographic information (see Figure 2) and Likert-style questions about different aspects of productivity, which were randomized in their order of appearance to the user. Figure 2 shows the demographic composition of our respondents. We note the significant proportion of professional programmers who responded.
The SPACE framework6 defines 5 dimensions of productivity: Satisfaction and well-being, Performance, Activity, Communication and collaboration, and Efficiency and flow. We use four of these (S,P,C,E) since self reporting on (A) is generally considered inferior to direct measurement. We included 11 statements covering these four dimensions in addition to a single statement: “I am more productive when using GitHub Copilot.” For each self-reported productivity measure, we encoded its five ordinal response values to numeric labels (1 = Strongly Disagree, , 5 = Strongly Agree). We include the full list of questions and their coding to the SPACE framework in Appendix C. For more information on the SPACE framework and how the empirical software engineering community has been discussing developer productivity, please see the following section.
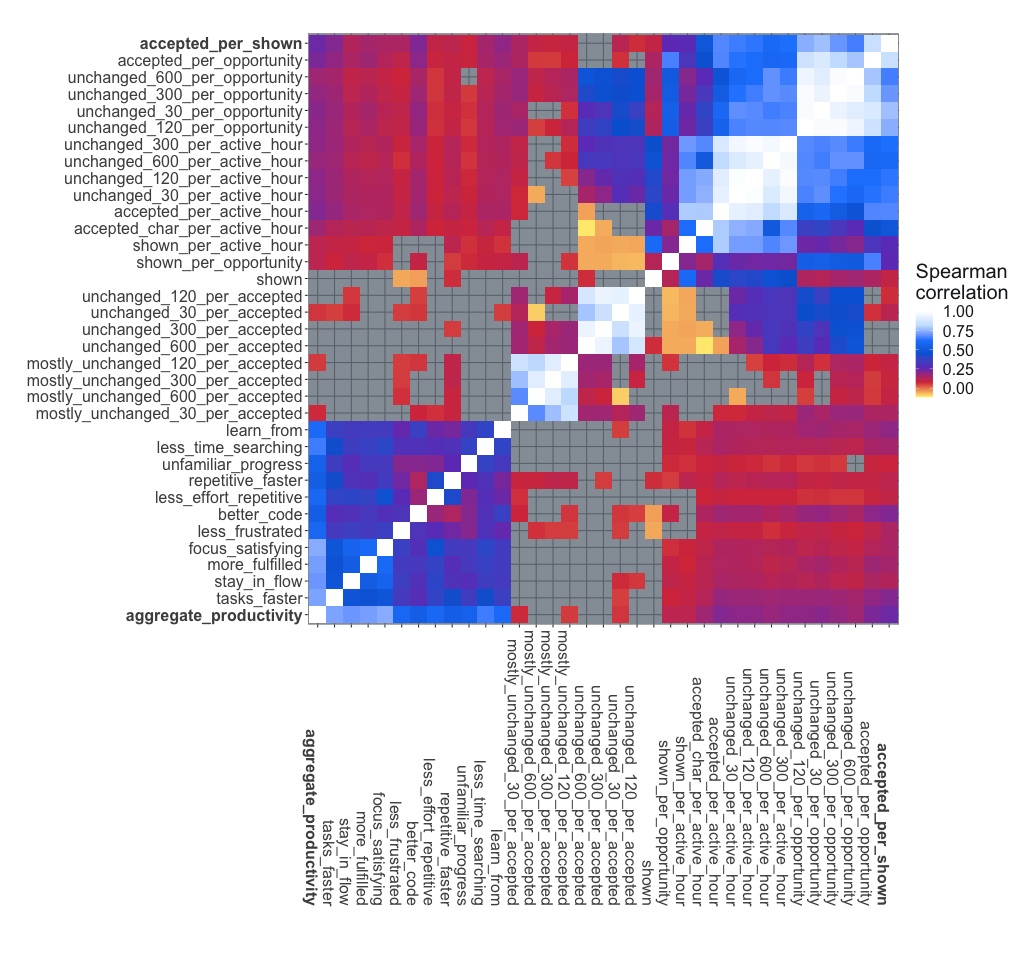
Early in our analysis, we found that the usage metrics we describe in the Usage Measurements section corresponded similarly to each of the measured dimensions of productivity, and in turn these dimensions were highly correlated to each other (Figure 3). We therefore added an aggregate productivity score calculated as the mean of all 12 individual measures (excluding skipped questions). This serves as a rough proxy for the much more complex concept of productivity, facilitating recognition of overall trends, which may be less discernible on individual variables due to higher statistical variation.
The full dataset of these aggregate productivity scores together with the usage measurements considered in this article is available at https://github.com/wunderalbert/prod-neural-materials.
Given it has been impossible to produce a unified definition or metric(s) for developer productivity, there have been attempts to synthesize the factors that impact productivity to describe it holistically, include various relevant factors, and treat developer productivity as a composite measure17,19,24 In addition, organizations often use their own multidimensional frameworks to operationalize productivity, which reflects their engineering goals—for example, Google uses the QUANTS framework, with 5 components of productivity.27 In this article, we use the SPACE framework,6 which builds on synthesis of extensive and diverse literature by expert researchers and practitioners in the area of developer productivity.
SPACE is an acronym of the five dimensions of productivity:
S (Satisfaction and well being): This dimension is meant to reflect developers’ fulfillment with the work they do and the tools they use, as well as how healthy and happy they are with the work they do. This dimension reflects some of the easy-to-overlook trade-offs involved when looking exclusively at velocity acceleration (for example, when we target faster turnaround of code reviews without considering workload impact or burnout for developers).
P (Performance): This dimension aims to quantify outcomes rather than output. Example metrics that capture performance relate to quality and reliability, as well as further-removed metrics such as customer adoption or satisfaction.
A (Activity): This is the count of outputs—for example, the number of pull requests closed by a developer. As a result this is a dimension that is best quantified via system data. Given the variety of developers’ activities as part of their work, it is important that the activity dimension accounts for more than coding activity—for instance, writing documentation, creating design specs, and so on.
C (Communication and collaboration): This dimension aims to capture that modern software development happens in teams and is, therefore, impacted by the discoverability of documentation or the speed of answering questions, or the onboarding time and process of new team members.
E (Efficiency and flow): This dimension reflects the ability to complete work or make progress with little interruption or delay. It is important to note that delays and interruptions can be caused either by systems or humans, and it is best to monitor both self-reported and observed measurements—for example, use self-reports of the ability to do uninterrupted work, as well as measure wait time in engineering systems).
What Drives Perceived Productivity?
To examine the relationship between objective measurements of user behavior and self-reported perceptions of productivity, we used our set of core usage measurements (Table 2). We then calculated Pearson’s R correlation coefficient and the corresponding p-value of the F-statistic between each pair of usage measurement and perceived productivity metric. We also computed a PLS regression from all usage measurements jointly.
We summarize these results in Figure 3, showing the correlation coefficients between all measures and survey questions. The full table of all results is included in Appendix B, available online.
We find acceptance rate (accepted_per_shown) most positively predicts users’ perception of productivity, although, given the confounding and human factors, there is still notable unexplained variance.
Of all usage measurements, acceptance rate correlates best with aggregate productivity (, ). This measurement is also the best performing for at least one survey question in each of the SPACE dimensions. This correlation is high confidence but leaves considerable unexplained variance. Later, we explore improvements from combining multiple usage measurements together.
Looking at the more detailed metrics around persistence, we see that it is generally better over shorter time periods than over longer periods. This is intuitive in the sense that shorter periods move the measure closer to acceptance rate. We also expect that at some point after accepting the completion it becomes simply part of the code and so any changes (or not) after that point will not be attributed to GitHub Copilot. All persistence measures were less well correlated than acceptance rate.
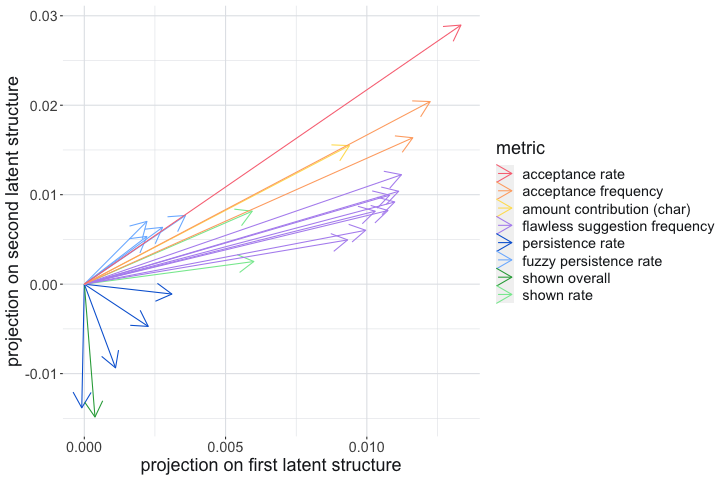
To assess the different metrics in a single model, we ran a regression using projection on latent structures (PLS). The choice of PLS, which captures the common variation of these variables as is linearly connected to the aggregate productivity,28 is due to the high collinearity of the single metrics. The first component, to which every metric under consideration contributes positively, explains of the variance. The second component captures the acceptance rate/change rate dichotomy; it explains a further . Both draw most strongly from acceptance rate.
This strongly points to acceptance rate being the most immediate indicator of perceived productivity, although it is beneficial to combine with others to get a fuller picture.
Experience
To understand how different types of developers interact with Copilot, our survey asked respondents to self-report their level of experience in two ways:
“Think of the language you have used the most with Copilot. How proficient are you in that language?” with options “Beginner”, “Intermediate”, and “Advanced”.
“Which best describes your programming experience?” with options starting with “Student” and ranging from “0-2 years” to “16+ years” in two year intervals.
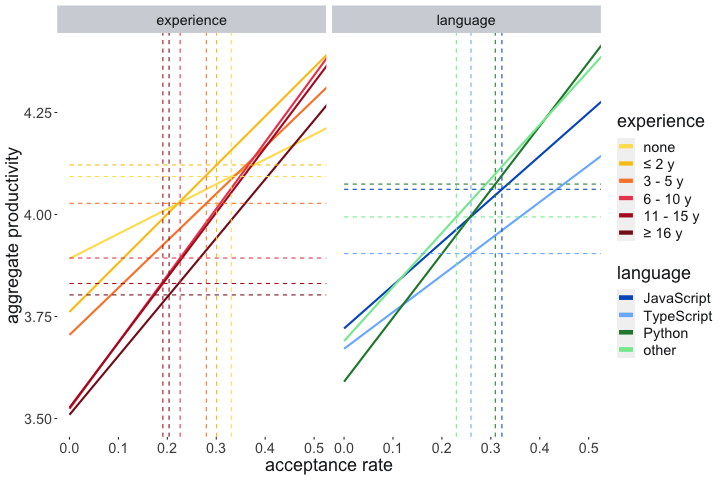
We compute correlations with productivity metrics for both experience variables and include these two variables as covariates in a multivariate regression analysis. We find that both are negatively correlated with our aggregate productivity measure (proficiency: , ; years of experience: , ). However, in multivariate regressions predicting productivity from usage metrics while controlling for demographics, proficiency had a non-significant positive effect (, ), while years of experience had a non-significant negative effect (, ).
Looking further at individual measures of productivity, (Table 3) we find that both language proficiency and years of experience negatively predict developers agreeing that Copilot helps them write better code. However, proficiency positively predicts developers agreeing that Copilot helps them stay in the flow, focus on more satisfying work, spend less effort on repetitive tasks, and perform repetitive tasks faster. Years of experience negatively predicts developers feeling less frustrated in coding sessions and perform repetitive tasks faster while using Copilot, but positively predicts developers making progress faster when working in an unfamiliar language. These findings suggest that experienced developers who are already highly skilled are less likely to write better code with Copilot, but Copilot can assist their productivity in other ways particularly when engaging with new areas and automating routine work.
Experienced developers who are already highly skilled are less likely to write better code with Copilot, but Copilot can assist their productivity in other ways.
| productivity measure | coeff | |
|---|---|---|
| proficiency | better_code | |
| proficiency | stay_in_flow | |
| proficiency | focus_satisfying | |
| proficiency | less_effort_repetitive | |
| proficiency | repetitive_faster | |
| years | better_code | |
| years | less_frustrated | |
| years | repetitive_faster | |
| years | unfamiliar_progress |
(*: p < 0.05, **: p < 0.01, ***: p < 0.001.)
| subgroup | coeff | n |
|---|---|---|
| none | 344 | |
| 2y | 451 | |
| 3 – 5 y | 358 | |
| 6 – 10 y | 251 | |
| 11 – 15 y | 162 | |
| 16 y | 214 | |
| JavaScript | 1184 | |
| TypeScript | 654 | |
| Python | 716 | |
| other | 1829 |
Junior developers not only report higher productivity gains; they also tend to accept more suggestions. However, the connection observed in section “What Drives Perceived Productivity” is not solely due to differing experience levels. In fact, the connection persists in every single experience group, as shown in Figure 5.
Variation over Time
Its connection to perceived productivity motivates a closer look at the acceptance rate and what factors influence it. Acceptance rate typically increases over the board when the model or underlying prompt-crafting techniques are improved. But even if these conditions are held constant (the study period did not see changes to either), there are more fine-grained temporal patterns emerging.
For coherence of the cultural implications of time of day and weekdays, all data in this section was restricted to users from the U.S. (whether in the survey or not). We used the same time frame as for the investigation in the previous section. In the absence of more fine-grained geolocation, we used the same time zone to interpret timestamps and for day boundaries (Pacific Standard Time), recognizing that this will introduce some level of noise due to the inhomogeneity of U.S. time zones.
Nevertheless, we observe strong regular patterns in overall acceptance rate (Figure 6). These lead us to distinguish three different time regimes, all of which are statistically significantly distinct at (using bootstrap resampling):
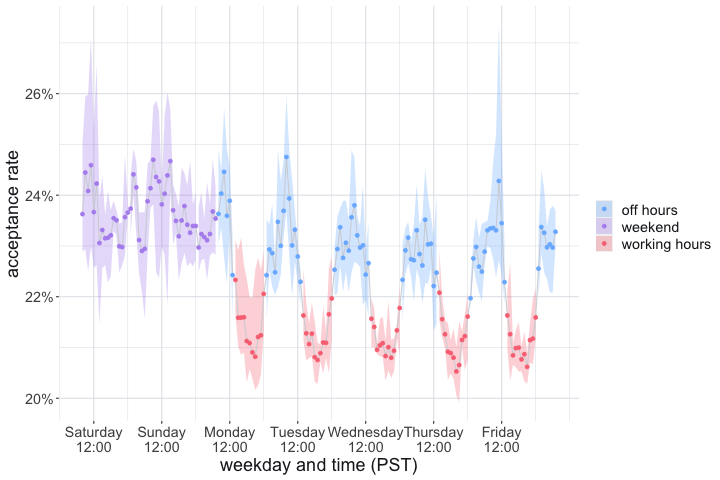
The weekend: Saturdays and Sundays, where the average acceptance rate is comparatively high at .
Typical non-working hours during the week: evenings after 4:00 pm PST until mornings 7:00 am PST, where the average acceptance rate is also rather high at .
Typical working hours during the week from 7:00 am PST to 4:00 pm PST, where the average acceptance rate is much lower at .
Conclusions
When we set out to connect the productivity benefit of GitHub Copilot to usage measurements from developer activity, we collected measurements about acceptance of completions in line with prior work, but also developed persistence metrics, which arguably capture sustained and direct impact on the resulting code. We were surprised to find acceptance rate (number of acceptances normalized by the number of shown completions) to be better correlated with reported productivity than our measures of persistence.
In hindsight, this makes sense. Coding is not typing, and GitHub Copilot’s central value lies not in being the way the user enters most of their code. Instead, it lies in helping the user to make the best progress toward their goals. A suggestion that serves as a useful template to tinker with may be as good or better than a perfectly correct (but obvious) line of code that only saves the user a few keystrokes.
This suggests that a narrow focus on the correctness of suggestions would not tell the whole story for these kinds of tooling. Instead one could view code suggestions inside an IDE to be more akin to a conversation. While chatbots such as ChatGPT are already used for programming tasks, they are explicitly structured as conversations. Here, we hypothesize that interactions with Copilot, which is not a chatbot, share many characteristics with natural-language conversations.
We see anecdotal evidence of this in comments posted about GitHub Copilot online (see Appendix E for examples) in which users talk about sequences of interactions. A conversation turn in this context consists of the prompt in the completion request and the reply as the completion itself. The developer’s response to the completion arises from the subsequent changes which are incorporated in the next prompt to the model. There are clear programming parallels to factors such as specificity and repetition that have been identified to affect human judgements of conversation quality.18 Researchers have already investigated the benefits of natural-language feedback to guide program synthesis,2 so the conversational framing of coding completions is not a radical proposal. But neither is it one we have seen followed yet.
 This work is licensed under a Creative Commons Attribution International 4.0 License.


Join the Discussion (0)
Become a Member or Sign In to Post a Comment