Global climate change is a huge challenge facing society today. The rapid growth of computing overall and of machine learning in particular rightfully raises concerns about their carbon footprints. As an early and enthusiastic adopter of ML, a manufacturer of millions of smartphones annually, and a significant cloud provider, Google is in a nearly unique position to compare the impact and efficiency of ML on the two ends of the information technology (IT) computing spectrum.
This article makes four main observations:
Most energy studies of smartphones ignore chargers, but they surprisingly use ∼3× as much energy as the smartphones themselves, with the main culprits being the use of multiple chargers per phone and the inefficiency and increasing popularity of wireless chargers. Compared to cloud datacenters, this energy overhead (charger power usage effectiveness) is ∼2.9× worse.
Smartphones can charge at off-peak hours, and many ML workloads can also shift to run at off-peak times. However, the cloud also lets ML experts to shift to remote sites with much greener energy, while phones predominantly must use whatever the local utility provides. Given the 2.9× higher energy overhead, ML training on devices can have up to ∼25× the carbon emissions as doing it in the cloud even if the computation energy was the same.
One example suggests ML training on smartphones uses up to 12× the computation energy of datacenter training. There are privacy and other advantages for training on devices, but combining 12× with the previous observation means carbon dioxide equivalent emissions (CO2e, including greenhouse gasses) can be two orders of magnitude higher.
From 2019 to 2021, ML represented between 10% and 15% of the total annual operational energy use in the Google cloud (with ⅖ of that for training) and less than 3% of the total annual operational energy use on smartphones (with 1/100 of that for training) in 2021. The major climate change challenge for IT is elsewhere, likely the embodied CO2e from manufacturing computers.
Keep in mind this article is not a comparison of all computation done on phones and the cloud, but solely on the impact of ML on energy use and operational CO2e. We provide the data to support these insights. While primarily focused on operational CO2e generated from computer use, we also address the relative impact of embodied CO2e.
Key Insights
Smartphone charger inefficiency is a much larger energy consumption issue than ML on smartphones. Chargers were responsible for 70% of energy use while ML was <3%.
While training ML models on smartphones has inherent advantages for privacy, it can have 100× the carbon footprint of training in the cloud.
In 2021, ML energy use was <15% of Google datacenter and <3% of smartphones. The bigger carbon challenge for IT is likely the embodied carbon footprint from manufacturing computers in general and smartphones in particular. The embodied carbon footprint of the short-lived smartphones in 2021 was nearly 3× that of datacenter servers. Despite their large, embodied carbon cost, we have discarded 7.5 billion smartphones in the recent past.
How Significant Is Charger Energy Use Compared to Smartphones Themselves?
Computers in datacenters draw electricity from the grid continuously. Because smartphones operate from a battery, they only draw electricity from the grid when connected to a charger. To account for smartphone ML energy accurately, we must include the energy overhead of their chargers. Smartphones are charged two ways:
Wired charging via a cable and an AC/DC adapter, and
Wireless charging via inductive coils in addition to the AC/DC adapter.
Wireless charging is increasingly popular due to its convenience and the reduction in smartphone wear and tear by avoiding the repeated insertion of a cable.
For wired charging, energy is lost from the AC/DC power adapter in the charger and in the power management integrated circuit (PMIC) battery charger in the phone. Wireless charging loses additional energy through the inductive coils. The percentage of energy going to the smartphone is then:
For conventional designs, the efficiencies are 80% for the adapter, 80% for the inductive coils, and 90% for the battery charging circuitry. The 2018 USB Power Delivery 3.0 standard offers a programmable power supply (PPS) that improves efficiency: 90% for the adapter, 83% for the inductor coils, and 97% for the battery charging circuitry.
Using the formulas here, the overall charger efficiencies are 58% (80% × 80% × 90%) for non-PPS wireless chargers, 72% (90% × 83% × 97%) for PPS wireless chargers, 72% (80% × 90%) for non-PPS wired chargers, and 87% (90% × 97%) for PPS wired chargers. Thus, wireless chargers are ∼1.25× less efficient while charging phones.
The charger uses sensors to detect when even an uncharged phone is connected to it. In addition to the smartphone charger efficiency when it is in use, we also need to account for vampire power usage. Also called standby power, it is the power wasted by the charger when not connected to a smartphone. Vampire power adds up and can be a significant amount of energy consumed.
A final factor is maintenance mode power, the power consumed when the phone is fully charged but it is still connected to the charger. Depending on the charger, it can still draw significant energy even when the smartphone does not need any more energy.
The total energy consumption of a smartphone and charger is then:
A further complexity is that many smartphone users have multiple plugged-in chargers. One survey found that 23% of users had only one charger, but 39% had four or more.38 If we assume the 39% had exactly four chargers, the average of that survey is 2.7 chargers per smartphone.
Datacenters use the industry standard metric of power usage effectiveness (PUE), which accounts for the energy “wasted” that goes into the datacenter but is used for power distribution and cooling instead of powering the computers in the datacenter. If the energy overhead was 50%, the PUE would be 1.50. The global average datacenter PUE28 is ∼1.60, while cloud datacenter PUEs are typically ∼1.10.
We propose a new metric to quantify the efficiency of a smartphone with its chargers analogously to the datacenter PUE where the goal is to try to get as close to 1.00 as possible. We define charger PUE (CPUE) as
where vampire energy idle chargers is the energy consumed by chargers plugged in but unused.
Google measurements supply some of the parameters needed to calculate CPUE:
The average wireless charger use was 42% and 58% for wired chargers, with the wireless percentage higher for newer phones and lower for older phones.
Average time to fully charge was 107 minutes (1.8 hours), like EPA’s 2-hour estimate.12
Average hours in maintenance mode were 302 minutes (5.0 hours), close to a 2011 study that reported 4.6 hours.30
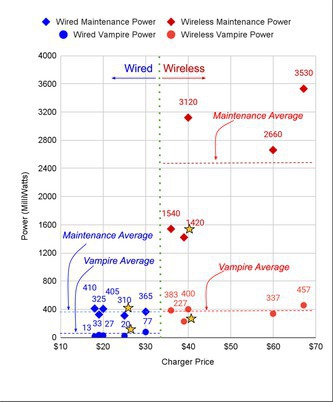
We also purchased and measured five wired and five wireless chargers both from smartphone manufacturers (Apple, Google, Samsung) and from third-party suppliers (Anker, Belkin). To test maintenance mode, we used the average of a fully charged Pixel Pro 6 and a fully charged Pixel 5. They were turned off, so that no applications could run during maintenance mode. If apps were left on—which might be the more typical case—maintenance mode power would be even higher, so these numbers might be conservative. All chargers were measured using a Poniie PN1500 portable power meter, which is accurate to ±10 milliwatts and has a range down to 20 milliwatts.a
Figure 1 plots the individual measurements versus their price. Our findings:
Wireless chargers are more expensive and use more power than wired chargers; their overall average energy use over 24 hours is 2.4× higher.
Surprisingly, money doesn’t buy efficiency. The most power efficient wired charger is Google’s and Apple sold the wireless charger winner. They use 40%–60% less energy but are 20%–70% cheaper than the high-priced ones.
Average vampire mode power for wired chargers is 34±25 milliwatts and 363±45 for wireless chargers (∼11× more than wired).
Average maintenance mode power for wired chargers is 361±86 and 2454±942 for wireless (∼7×). Thus, the average wireless vampire power matches the average wired maintenance power.
Using these values for the parameters in the equations here, Table 1 calculates the smartphone CPUE by charger and phone type and then summarizes aggregate information for a mix of 2.7 chargers per phone, 42% wireless, and 50% PPS. The higher vampire power usage of wireless chargers is tenfold that of wired chargers. Given these assumptions on the portion that are PPS, the portions that are wireless, and number of chargers, CPUE is ∼3.1. That is, charger overhead energy is ∼2.1 times what a smartphone uses.
| Wired | Wireless | |||
|---|---|---|---|---|
| No PPS | PPS | No PPS | PPS | |
| Smartphone (Wh) | 9.28 | |||
| Charger charging (Wh) | 3.61 | 1.35 | 6.83 | 3.53 |
| Maintenance mode (Wh) | 1.82 | 12.35 | ||
| Vampire if used (Wh) | 0.58 | 6.24 | ||
| Vampire if unused (Wh) | 0.82 | 8.71 | ||
| Avg. charger energy (Wh: 1 charger) | 6.01 | 3.75 | 25.42 | 22.12 |
| Charger PUE (1 charger) | 1.65 | 1.40 | 3.74 | 3.38 |
| Average charger energy (Wh: 2.7 chargers, 42% wireless, 50% PPS) | 19.84 | |||
| Charger PUE (2.7 chargers) | 3.14 | |||
To test the sensitivity to these values, we calculated CPUE by varying each assumption individually either by subtracting or adding the standard deviation to the average or halving or by doubling a parameter while keeping the other parameters constant. Table 2 shows the results. CPUE is most sensitive to the percent of wireless chargers (2.41–4.60) followed by the number of chargers per smartphone (2.54–4.34) and wireless maintenance mode power level (2.92–3.35). For this wider range of parameters, CPUE is at least ∼2× to as much as ∼5× the energy consumption of smartphones by themselves.
| Item | Value | CPUE | |||
|---|---|---|---|---|---|
| Nominal | Low | High | Low | High | |
| Number of Chargers | 2.7 | 1.35 | 5.4 | 2.54 | 4.34 |
| Wireless % | 0.42 | 0.21 | 0.84 | 2.41 | 4.60 |
| Wireless Maintenance Mode (mW) | 2454 | 1512 | 3396 | 2.92 | 3.35 |
| 363 | 318 | 408 | 3.02 | 3.26 | |
| Wireless Vampire Mode (mW) | |||||
| Power Supply (nonPPS) | 0.5 | 0.25 | 1 | 3.07 | 3.28 |
| Wired Maintenance Mode (mW) | 361 | 275 | 447 | 3.11 | 3.16 |
| Wired Vampire | 34 | 9 | 59 | 3.05 | 3.23 |
| Wireless Vampire Mode (mW) | |||||
How Do Cloud Energy Use and Carbon Emissions Compare to Those for On Device?
The 4Ms determine the carbon footprint of training in the datacenter:28 Model, machine, mechanization (datacenter PUE), and map (input energy carbon intensity per geographic location). Presuming we train the same model on the datacenter and on device, the efficiency of the three other Ms determines their relative carbon footprint. The CPUE of 3.1 for smartphone chargers is 2.9× the typical 1.10 PUE of cloud datacenters. The global average energy carbon intensity is appropriate for the 6.6B smartphones. However, the cloud allows training to be moved to datacenters with a high percentage of carbon free energy (CFE), which means using renewable energy (for example, solar or wind) or nuclear energy. In 2021, the average CFE portion was ∼40% for U.S. and Europe and ∼30% for Asia.
The global average conversion factor from electricity to CO2e is 0.475kg/kWh. Patterson et al. found that training in Oklahoma reduced carbon emissions by >6× (to 0.074) versus the global average due to its 93% CFE, as Google acquired renewable energy in Oklahoma matched on an hourly basis with its energy consumption.28 Thus, even if the energy consumption for the computation was the same in the cloud and on device, the carbon emissions could be ∼25 times higher on device.b
How Does Energy Consumed for ML Training in Cloud Datacenters Compare to Training on Smartphones?
Comparing federated learning to datacenter training is challenging because the inherently more limited resources on a phone typically lead to different model designs and training approaches, which together with differences in the training data distribution and accessibility lead to quality differences.
Despite these challenges, we thought it would be interesting to get a ballpark estimate of differences between training on the datacenter and on device. As a case study, we compare the energy consumed for training an identical model per 10M training examples processed in the datacenter and in a federated setting. We identified a prototype ∼10,000 parameter multi-layer perceptron model used for semantic location inference, which is the process of inferring a device’s location in terms of a place as defined in the Android Places SDK (for example, local business or point of interest) instead of in coordinate space. We ran it on TPUv4 lite, and the average energy of three runs was 59 kilojoules.
The TPUv4 lite chip23 trains this workload in under two minutes. This experiment has its limitations:
The smartphone workload was not tuned to the TPU. It is currently I/O bound, so the TPUv4 lite chip is nearly idle at under 1% utilization.
Moreover, despite trying to compute on only one host CPU, the dual CPU host server of TPUv4 lite uses 86% of the 47 kilojoules for the workload. This server is overkill for this application.
However, this energy calculation omits the energy to process the raw data in the datacenter. We also assumed 10M examples are sufficient to train for batch size 64, but we didn’t check for convergence.
We suspect that tuning the workload to reduce I/O bottlenecks and properly configure the host hardware would reduce datacenter energy consumption significantly.
For federated learning, the average user holds 16 training examples with typically 10 local epochs, so 160 examples are processed per device session. This ratio yields 62,500 device training sessions per 10 million training examples processed. Assuming typical energy consumption figures, Table 3 shows an energy use of 186 kilojoules on the smartphone and 381 kilojoules in the communication and serving infrastructure for a total of 567 kilojoules.
| Power / Energy Consumption | Measurements for Model | Energy (J) | |
|---|---|---|---|
| Phone Wakelock | <100mW | 5s | 0.5 |
| Phone Communication (WiFi) | 130nJ / bit | 250KB | 0.27 |
| Phone Computation (CPU) | 440mW | 5s | 2.2 |
| Subtotal (Phone) / Device Session | 2.97 | ||
| Fixed Broadband (variable cost) | 0.5W @ 10Mbps = 50nJ/bit | 250KB | 0.1 |
| Federated learning server | 6J/ device session | 6 | |
| Subtotal (Infra) / Device Session | 6.1 | ||
| Device Sessions / 10M examples | 62,500 | ||
| Phone / 10M examples | 185,625 | ||
| Infra / 10M examples | 381,250 | ||
| Total | 566,875 | ||
This estimate for on device energy is also limited:
The model uses a relatively low number of training examples per user device, which results in an even larger number of device training sessions. With more training data per device, per session costs would be better amortized and we would expect federated learning overhead to decrease significantly.
The five seconds for processing reported through our telemetry includes additional waiting time and other lower energy states.
The federated learning server figure of 6J/device session represents an average over all models and is likely an overestimate for this small model.
It doesn’t account for the difference in data transfer to the datacenter of all the raw data versus federated learning only needing to access the portion of the data needed for the calculation.
However, it omits the relatively large fixed-energy cost of the broadband infrastructure (and wireless access point), since it typically remains on regardless of whether federated learning or other communications are active. Including amortized fixed costs increases federated learning energy use ∼4× to 2.3 megajoules.
Although it is difficult to make a fair and detailed comparison between a training task done on smartphones and in the datacenter, the estimated ∼567 kilojoules for federated learning represents ∼12× of the estimated ∼47 kilojoules for datacenter training. For the reasons given here, this observation is only a ballpark estimate.
In addition to the ∼12× energy increase over the datacenter, the ∼25× overhead in emissions due to the higher PUE and higher carbon content energy of on-device computation suggests the datacenter is the much lower emissions option for applications where the data processing location is flexible.
How Does ML Energy Use in Cloud Datacenters Compare to its Use on Devices?
Patterson et al. showed that between 10% and 15% of Google’s overall energy usage in datacenters was for ML.28 The next step to answer this section’s question is to see where the energy goes in smartphones.
Table 4 shows the energy breakdown of four smartphones between their major components: the System on a Chip (plus DRAM energy), wireless, display, and the rest (including audio and camera). A rule of thumb from Table 4 is that little more than ½ of the energy is for wireless and the display, a little more than ⅓ is for the SOC, and the rest use about 1/10.
| Smartphone | Neo Freerunner | iMate Kjam | HTC HD2 | Pixel 6 | Average |
|---|---|---|---|---|---|
| SoC | 33% | 35% | 37% | 40% | 36% |
| Wireless | 44% | 57% | 26% | 23% | 37% |
| Display | 9% | 3% | 26% | 29% | 17% |
| Rest | 14% | 5% | 10% | 9% | 10% |
The main SoC is the biggest integrated circuit in a smartphone and contains CPUs, memory interfaces, and domain specific processors such as GPUs and ML accelerators. The Edge Tensor Processing Unit (TPU) is Google’s ML accelerator, similar in spirit to the Apple Neural Engine and the Samsung NPU.4,21
Understanding the energy for ML requires examining the SoC energy. Figure 2a breaks down its energy consumption to the primary power using components for the Pixel 6 SoC for the average of many workloads. This data was collected running workloads in our labs, which are consistent with measurements of smartphones in the field.
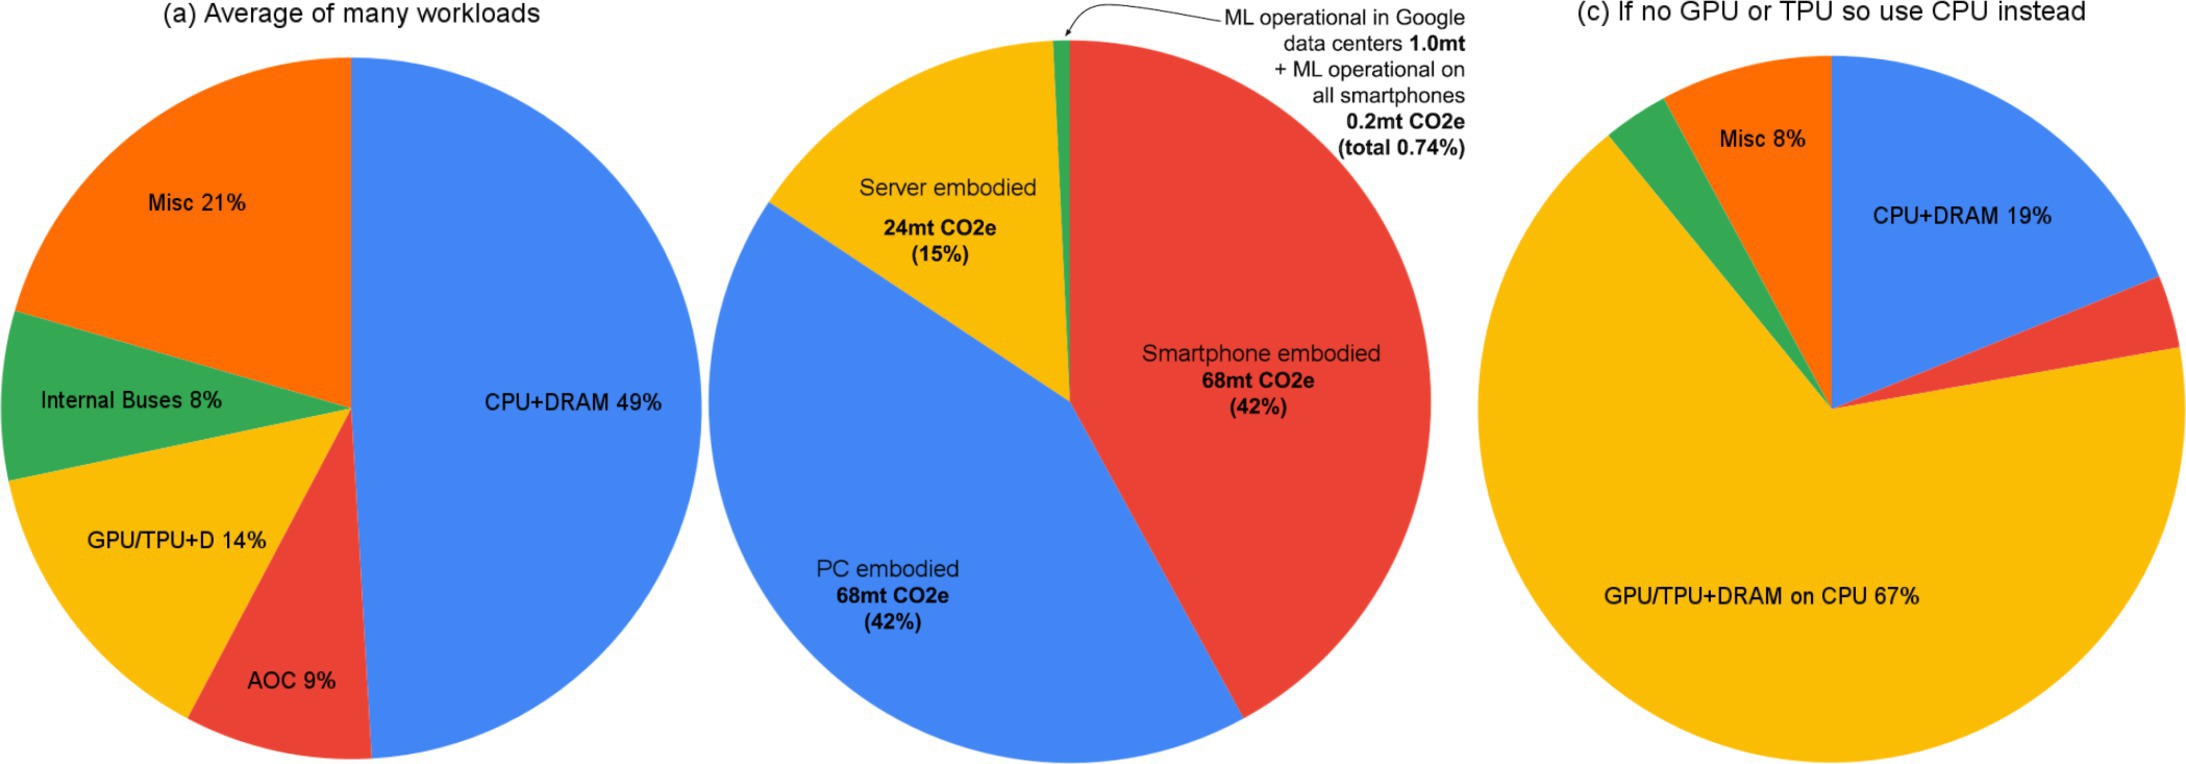
One might wonder if the GPU and TPU are important since the CPU uses more than three times as much energy. The average use belies their value for three reasons.
First, smartphone applications can be limited either by long-term average energy use (which drains the battery), instantaneous energy use (to prevent overheating), or by latency (impacting user experience); the GPU and TPU help with all three. Even if on average they don’t use as much energy, they enable applications that would otherwise be infeasible on a smartphone CPU. For example, Google Camera ambient recognition of visual entities (QR codes, text, objects, among others) allows rapid detection and proactively highlights so the user may act on them. The Edge TPU keeps latency low, so the system remains interactive and energy consumption low to avoid thermal problems. The performance/Joule improvement of the Edge TPU over the CPU for this application is 12.5×.
Second, given billions of phones and users, smartphone engineers design for many workloads, not just one. Figure 2b shows the GPU and TPU are ⅓ of one video workload.
Finally, Figure 2a shows energy use after the application was accelerated; it doesn’t show what the energy use would be if it was all done on the CPU. Assuming the TPU and GPU provided 12.5× performance/Joule over the CPU, SOC energy would increase 2.6× and their portion would now be ⅔ of the energy, as Figure 2c shows.
To answer our question about the energy use, 36% is for SOCs (Table 4). Although most ML uses accelerators and the GPUs, some still use CPUs. Most CPU workloads are for the popular non-ML use cases such as social media, video streaming, browsing, messaging, and so on. An exact CPU percentage for ML is difficult to determine, but an upper bound is easier to estimate. We assume ∼10% of CPU energy and ∼25% of the GPU and TPU energy is for ML inference, which are generous upper bounds. Our upper bound estimate for ML is:
The answer to the question at the outset of this section is that ML represents <3% of smartphone energy use and 10%–15% of datacenter energy use.
What Portion of Energy is for ML Training versus Inference?
Patterson et al.28 found the ML energy use in Google datacenters was 40% for training and 60% for inference. We now calculate the split for smartphones.
Google uses a new federated learning system that trains ML models on devices. One advantage of federated learning is that it doesn’t require shipping data to the datacenter, which preserves privacy.
To account for real world conditions, we estimate the energy consumption of an average device session using telemetry from Google’s federated learning system while this model is training on a fleet of Android devices. A federated learning training session involves four steps:
Connecting with and waiting for the server to signal the start of a training round;
Downloading model parameters;
Setting up and executing training computations; and,
Uploading the model update.
We therefore expect the dominant factors on the smartphone are communication, computation, and to some extent the wakelock drain while waiting for the server to start a training round. Hence, we model training session energy consumption as follows:
Communication energy consumption varies widely based on the amount of ML model parameters that need to be transferred and the quality of WiFi link. We use an energy/bit model to account for the varying data transfer sizes and choose an average energy/bit figure of 130nJ/bit based on reported measurements.35 Note that from high to low link quality, WiFi energy/bit can change by about two orders of magnitude.
To estimate the total energy consumed in federated learning, we studied the daily energy consumption of three models that we believe to be representative of models currently being trained in Google’s production federated learning system. Table 5 summarizes the results. To put individual smartphone energy usage for ML training into perspective, the range observed here generally requires a few seconds of additional phone charging time.
| Model | Gboard | Model B | Chat |
|---|---|---|---|
| Phone Wakelock | 9J | 1J | 15J |
| Phone Communication | 26.3J | 0.6J | 2.1J |
| Phone Computation | 39.6J | 2.2J | 22J |
| Phone Energy / device session | 75.5J | 3.8J | 39.1J |
| Infra Energy / device session | 16.4J | 6.2J | 6.8J |
| Device sessions / day | 150K | 600K | 14K |
| Energy per day (across all devices) | ∼=11.3MJ (3.1kWh) | ∼=2.2MJ (0.6 kWh) | ∼=0.5MJ (0.1kWh) |
| Energy per day (infra + all devices) | ∼= 13.8MJ (3.8kWh) | ∼= 6MJ (1.6kWh) | ∼= 0.6MJ (0.2kWh) |
Using the highest smartphone energy estimate of the three sample models (75.5J per device session) and the count of device sessions per day from our telemetry, this yields an upper bound of 11.3GJ or 3.1MWh per day, which represents less than 0.01% of the worldwide smartphone-only operational energy usage (not including chargers). We believe that even this estimate is a generous upper bound for federated learning since a significant fraction of these device sessions represent analytics (non-ML) workloads.
The answer to the question of this section is that training represents ∼40% of ML energy use in datacenters but on smartphones it is only ∼0.3%, a factor of ∼133x less.
Discussion
We now discuss a few insights from our investigation.
Does shifting the time of charging make smartphone charging energy use clean?
Some might think that shifting the time of charging made smartphone charging “clean.” This perspective may have been influenced by a new feature of the iOS 16.1 called “clean energy charging.”4 The iPhone uses forecasts of the CO2e in the local grid to charge an iPhone during times of cleaner energy production. Although limited to the US, it likely reduces CO2 a bit there. However, even within the U.S. there are many grids where the energy is 10X dirtier than others, no matter the time of day. Since 2021 Google has been reducing CO2e using the flexibility of the cloud to shift computation in both location and time,24 which is even more effective. Shifted examples are cloud training and offline inference. Finally, Table 2 points out the major use of energy when there is no phone on the charger—due to redundant chargers and due to vampire mode—which is unaffected by when a phone is charged.
What is the cost of making the cloud as privacy preserving for ML as smartphones?
Some might wonder if we should burden the cost of the cloud to be as privacy preserving as keeping data local to smartphones? Security experts14,30 commented that:
Today it would be many orders of magnitude more expensive;c
Sharing data is a matter of trust no matter the promises made;
Distributed training still sends information learned to a centralized server in the cloud; and
Sending the ML model to thousands of smartphones would expose the model and its weights (trained on private phone data) if any phones were compromised.
Trusted execution environments such as enclaves, which are already being deployed, may offer a path forward.
Reducing the energy of wireless chargers.
A primary consideration in designing the wireless charging systems is the feedback loop notifying the user that the device is charging. To search for a smartphone, a digital ping is sent periodically. There is an inverse relationship between the ping frequency and the idle power consumption of the charging system. Therefore, system trade-offs are made to stay within a power budget (250–500mW) and provide the least amount of latency (< 1 second). Another major design consideration is the overall bill of material cost for the wireless charger. In the consumer electronics industry, the competition is high and there is a concerted effort to drive down the overall cost, pressuring the design team to remove as many extra components as possible. This competition makes it more challenging to include features as a bonus that optimize energy efficiency.
Nevertheless, we were surprised how much higher the CPUE was for wireless than wired chargers. The wireless charger consumes large vampire power on average 17 hours a day even when the charger is empty.
A simplistic alternative would simply be to add an on/off button or a weight sensor that detects a smartphone to a wireless charger that controls power to the inductive coils. One estimate is one billion wireless powered smartphones in 2021.7 If hitting the button or sensing that there is no phone dropped vampire power usage to match wired chargers on all wireless chargers, turning off the coils could save ∼5.6 terawatt-hours and ∼2.7M t CO2e annually. Our upper-bound estimate for ML on smartphones at 3.1 terawatt-hours is ∼½ of these potential wireless charger energy savings.
The U.S. Environmental Protection Agency and the European Union set requirements for wired chargers that limit maximum vampire power. Perhaps they should investigate standards that reduce vampire power for wireless chargers as well?
Energy use and CO2e emissions from smartphones.
The 24-hour energy consumed by a typical smartphone is 9.28 watt-hours.10 One recent estimate is 6,648M smartphones.5 The total annual energy use by smartphones is then:
Google’s electricity usage in 2021 was 18.3TWh or ∼80% of worldwide smartphone energy use.3
Using the conversion factor of 4.75×10⁻⁴ metric tons of CO2 equivalent emissions (CO2e) per kilowatt-hour,20 the total annual emissions of smartphones is then ∼10.7 megatons of CO2e. Adding our CPUE estimate of 3.1, the total is ∼33.6 mt CO2e.
To put that total into perspective, it is the equivalent to ∼7.5M gasoline-powered passenger vehicles driven for one year. There are ∼1500M cars in the world today, so cars produce ∼200× the CO2e of smartphones.
The ML portion is <3%, so it is <1.0mt of CO2e. Google’s overall operational CO2e (location-based Scope 2) in 2021 was 6.6mt,15 and <15% is <0.97mt CO2e for ML
Comparing Operational to Embedded CO2e.
If the operational CO2e from ML is a modest contributor to global climate change, then what is the biggest climate change issue for IT? Our suspicion was that it is the embodied cost of IT.
The following computers were shipped in 2021:
Smartphones: ∼1,350,000,000,
PCs: ∼340,000,000,
Servers: ∼12,000,000.
Note that the numerous smartphones have the shortest lifetimes at only 2–3 years.
While embodied CO2e costs are not yet routinely published for all computers, we use the following approximations based on studies of smartphones and PCs and the limited data available for servers:
Smartphones: ∼50kg CO2e,25
PCs: ∼200kg,25
Servers: From ∼1000kg to ∼400019,26,33
To put embodied CO2e into perspective, a typical smartphone weighs 0.2kg, so the CO2e from manufacturing is ∼250× larger. The ratio for PCs is ∼75× and it is ∼150× for servers.
Figure 3 shows our ballpark estimate for the operational CO2e from ML in Google datacenters and all smartphones in 2021 compared to our estimate of the embodied CO2e for smartphones, PCs, and servers manufactured in 2021. Embodied CO2e for information technology may be two orders of magnitude larger than the operational CO2e from ML.
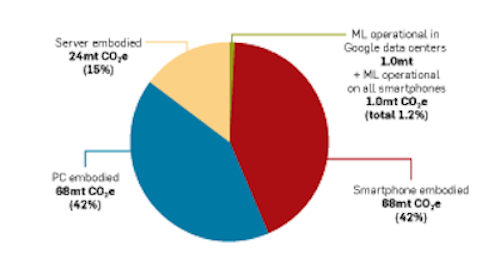
Note that Figure 3 is a snapshot of what happened in a single year. The conventional approach to comparing embodied and operational CO2e is to predict the operational CO2e for the equipment of a given year over the lifetimes of each computer, from 2–3 years for smartphones and 6–8 years for servers. We use the single year snapshot since we are trying to capture only the ML operational CO2e, which we can more easily estimate what it was for 2021 rather than predicting what the ML portion will be for the next 3–8 years.
While we account for all smartphones, we don’t for all datacenters. Google is one of the top three cloud providers, and it was an early adopter of ML, so its ML use might be larger than most. If we were to multiply the datacenter CO2 portion in Figure 3 by 10× to try to account for all datacenters, ML would still only be ∼7%.
Taiwan, South Korea, and Japan, with their low CFE, manufactured most of the chips in Figure 3. Changing the location of manufacture could potentially reduce CO2e, as half is from electricity use.36 Berger et al. predict decarbonizing the manufacturing supply chain of computers will take decades and cost hundreds of billions of dollars.6 Nevertheless, the imbalance between embodied CO2e and ML operational CO2e in Figure 3 is so large that even if we could go back in time and use much higher CFE to reduce embodied CO2e in 2021 by 5×, it would still be ∼15× higher than operational CO2e from ML.
Is operational CO2e from ML one of the largest climate change challenges in information technology?
The success and popularity of ML rightfully raised concerns about its environmental impact. Some estimates of CO2e from ML were so alarming—for example, training a model in 2024 could cost $100B and produce as much CO2e as New York City does in one month37—that we wanted to investigate to see what could be done to help. That inquiry led to this article and the work explored in Patterson et al.28
To our surprise, we found some ML papers overestimated CO2e by >100,000×.28 Despite considerable attention paid to the environmental impact of the operational cost of ML training, Figure 3 illustrates that embodied costs of manufacturing IT equipment might have been a ∼70× larger climate change problem in 2021 than the real operational CO2e from ML. If some prior claims about ML training were accurate, then it would have been reversed.
It’s critical to use accurate estimates of CO2e to ensure we focus on big problems. The flawed estimates on operational CO2e from ML training that were off by >100,000× led many interested in climate change to focus on ML rather than on more prominent challenges. This paper’s data highlights that the embodied costs of manufacturing IT equipment may have been >70× larger than operational ML emissions in 2021, so even modest gains on embodied hardware CO2e could easily eclipse large gains on operational ML CO2e. The short-lived smartphones are particularly glaring, as despite having an embodied carbon footprint nearly 3× that of servers in 2021, we have discarded 7.5 billion of them in the past five or so years.
Related Work
A flurry of papers evaluated the energy use of smartphones a few years after the iPhone was announced. Carroll and Heiser9 ran microbenchmarks to determine the energy use of hardware components as the SoC clock rates varied. They found that most of the power consumption was for the wireless radio module (GAM) and the display while the RAM, audio, and flash memory subsystems used the least. Ferreira et al.13 did a detailed energy measurement per smartphone function and found that the top six biggest energy users were downloading data using 3G, downloading data using WiFi, sending an SMS text, making a voice call, playing an MP3 file, and the display backlight. Later papers did similar calculations for other phones.1 Perrucci et al.29 analyzed users’ battery charging behavior to assess how often users demonstrate less than optimal charging behavior.
Since 2011, an abundance of papers have been published on smartphone energy issues, many simply surveying all the related literature. For example, Hoque et al.18 reviews energy profilers for mobile devices stating their limitations and challenges. Javed et al.22 survey different factors that consume energy in a smartphone. Zaman and Almusalli summarize 17 hardware and software enhancements that reduce energy consumption and the size of their benefits according to published research. These three papers survey 84, 96, and 41 publications, respectively. The most recent survey31 tops its predecessors by citing 418 papers!
In 2022, a Lawrence Berkeley Laboratory website listed measurements of charger energy. We contacted the website’s author, who said those numbers reflect the situation as of 10–20 years ago.27 He recommended not relying on this data, but to instead collect the data ourselves (Figure 1).
In terms of ML on smartphones, Almeida et al.2 study the prevalence of ML models and their inference efficiency in Android apps and found the number of models doubled within 12 months with the vast majority being vision-related models. The methodology cannot measure how frequently these models are invoked, but the authors predict that vision model energy consumption has the potential to be significant.
Cai et al.8 focus on measuring the efficiency of on-device training processes by benchmarking training time, memory use, and energy consumption with on-device models of varying size across different phones and ML libraries. They find that tuning training performance remains complex due to device heterogeneity, asymmetric multiprocessing, and variable batch size. They also report that current on-device ML libraries are optimized primarily for inference, resulting in a significantly larger gap between inference and training efficiency than in the datacenter.
Qui et al.32 report on a controlled experiment on IoT hardware (NVIDIA Tegra X2 and Xavier NX) that compares energy consumption and estimated carbon emissions in centralized and different federated training settings in the Flower framework. They show a wide range of emissions from federated learning from slightly less than 1 (better than centralized) to ∼100 times worse in carbon emissions. These experiments do not appear to include charging efficiency for mobile devices. While they show the variance in average carbon intensity between China, France, and the U.S., they ignore the gains of training at the greenest locations within a country, which can reduce emissions by factors of 5 to 10.28
Given the numerous publications it’s diffuclt to be certain, but we believe this is the first paper to look holistically at the energy consumption and carbon footprint of ML in smartphones. While other work shows how to calculate power for one charger,12 this article may also be the first to include the impact of chargers to assess overall smartphone energy use and carbon emissions.
We are certainly not the first to suggest that embodied CO2e swamps operational CO2e in information technology.16,17 It is difficult to calculate the collective impact of new computers accurately. Ideally, embodied CO2e would be routinely published—like clock rate and thermal design power—for new computing equipment, particularly for servers whose configurations vary more widely than smartphones and PCs.
Conclusion
As Google is a major player in ML, the cloud, and smartphones, it is an ideal case study to judge CO2e from ML. We found that ML energy consumption for cloud datacenters is 10%–15% for 2019–202128 and below 3% for smartphones in 2021. Part of the reason for this low level is that modern servers and smartphones include custom hardware to accelerate ML, which also reduces the energy consumption of ML. Indeed, our estimate for ML in datacenters is they consume 70%–80% of the floating-point computation but only 10%–15% of the energy.28 Presumably, without accelerators, ML could consume 70%-80% of the energy as well.
We uncovered some surprises related to smartphones. First, most phones have multiple chargers. Our estimates of the mix of wireless and wired chargers and the number of chargers per smartphone suggest that two-thirds of the overall energy smartphones are responsible for is due to their chargers rather than the phones themselves. If end users cut back on the number of chargers or unplug the ones they are not using, we could reduce CO2e related to smartphones. Second, wireless chargers are much less energy efficient (higher CPUE) than wired chargers. As wireless chargers are growing in popularity, we encourage techniques and policies to mitigate their energy impact. Third, charger prices are not correlated with energy efficiency. Apple and Google show that one can build power efficient chargers at reasonable prices; their chargers cost 20%–70% less than the high-priced ones yet consume 40%–60% less energy.
Another surprise is that on-device computation including training has a built-in disadvantage of up to 25× versus the datacenter. This gap is in part due to its worse PUE and because the cloud allows customers to pick remote datacenters with the cleanest energy nearly anywhere while smartphones must rely on local energy wherever they happen to be. While smartphones can shift charging to non-peak houses, in the cloud we can shift when and where many workloads run. Moreover, one case study suggests training on devices also uses ∼12 more energy than in the datacenter. Relying on the cloud and on device for inference and on the cloud for training while following best practices28 may be the best path to delivering on the amazing potential of ML sustainably.
The high cost of on-device ML training raises an interesting policy issue about the environment and privacy. It’s clearly easier to preserve privacy when computation is limited to the edge, but energy consumption and carbon emissions can be two orders of magnitude higher than in the cloud. We believe researchers, society, and policymakers should start a conversation about the relative importance of privacy versus climate change and whether one can dramatically reduce CO2e on the edge with its inherent privacy protection or to try to improve privacy in the cloud with its inherent environmental advantage to match that of on device computation.
Finally, it’s important to get the CO2e numbers right to ensure we work on the most significant environmental problems in IT (Figure 3). For colleagues interested in global climate change, a prominent target is the embodied costs of computers.
Acknowledgments
Thanks to Jeff Dean, Urs Hölzle, Raj Singh, Brock Taute, and Dennis Yee for feedback. Yun Liu, Stefan Dierauf, and Brett McLarnon helped with federated learning data, and Luis-Miquel Munguia ported it to TPUs and measured its energy. Dave Cassano helped with the power measurements of the chargers. Finally, we thank Tammo Spalink for suggesting we tackle ML on smartphones. We would also like to thank the anonymous reviewers for the remarkable time spent reviewing this article.


Join the Discussion (0)
Become a Member or Sign In to Post a Comment