We have yet to find a way to drill further deeper than eight miles below the Earth’s surface. To try to uncover the secrets that lurk hundreds of miles further down below the crust, scientists have found useful information in some unexpected places. Measurements taken from hundreds of miles above the Earth have done much to help geophysicists build computer simulations of the thousands of miles of rock beneath our feet. With that data, they are inching towards understanding what causes the Earth’s surface to shift and bend.
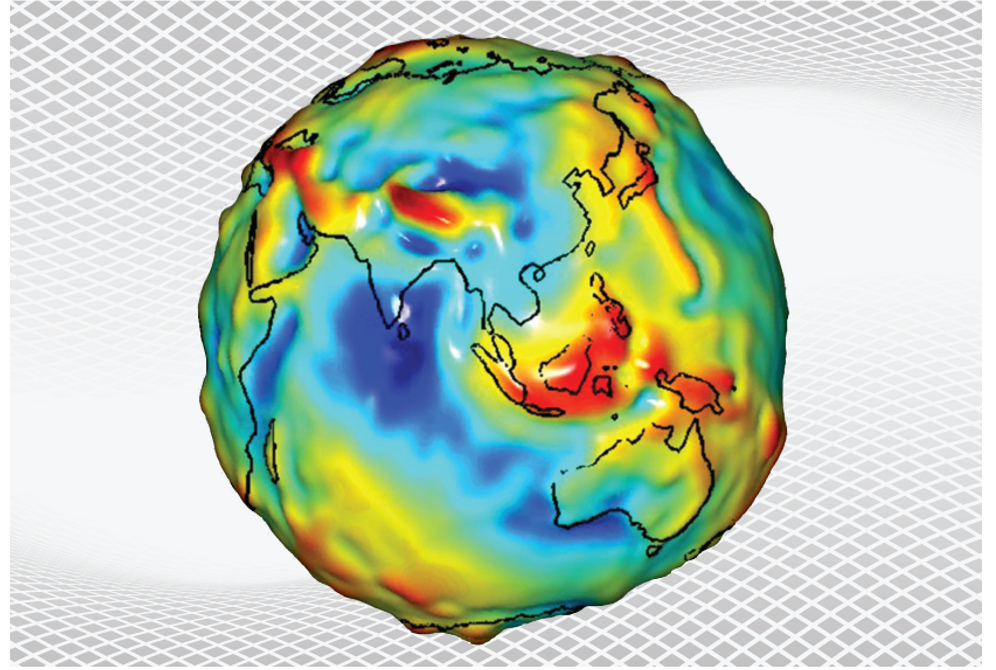
Soon after Sputnik 1 launched in the autumn of 1957, scientists realized they could detect changes in the Earth’s gravity field by recording subtle changes in orbital speed as the probe passed zones of higher or lower gravity caused by changes in the amount of mass below them. By the early 1970s, scientists had combined that rich source of global data with measurements they had taken on land and sea expeditions to build a model of the world, known as a geoid, that reflected all the dips and peaks in the Earth’s gravity field. And it presented several large puzzles.
One of those puzzles is an anomalous area of low gravity under the Indian Ocean, south of Sri Lanka. At the center of this roughly circular region covering 1.2 million square milesa, the sea level drops to almost 350 feetb below the global average because of the reduction in gravity. It would be easy to assume that such a change indicates the rocks under this region are less dense than those under the surrounding sea floor and continents. Yet reality is far less clear-cut.
“A low-density anomaly can cause either a geoid low or a geoid high,” says Bernhard Steinberger, geodynamic modeling group leader at the GFZ German Research Center for Geosciences (GFZ Potsdam). Depth plays a major role, he says; denser rock further down can generate the same gravity reading as something lighter, closer to the surface.
How mass is distributed is not the only contributor to gravitic anomalies; so is the nature of the rock that surrounds the anomaly. The biggest contributions to changes in gravity around the world come from the mantle. This is a layer that extends 1,800 milesc below the Earth’s crust, and is effectively solid despite temperatures of more than 1,000°C. Even though it is a billion times more viscous than cold tarmac, that rock can still deform and slide great distances over timescales measured in millions of years.
Many geophysicists believe the heat from the edge of the core heats parts of the lower mantle enough for it to expand and rise, in what they call a ‘plume’. This motion resembles the convection seen in boiling water, albeit in extreme slow motion.
Ultimately, the rock’s relative buoyancy can cause the material to rise and pool as a flattened disk less than a few hundred miles beneath the crust. Sometimes the material makes it all the way to the surface through volcanoes, such as those that formed the Hawaiian islands. Within the mantle, the differences in viscosity of these different materials cause them to distort against each other. And gravity readings reflect the resulting bulges and depressions.
Steinberger says a key obstacle to modeling the fine details of the mantle’s structure in simulation remains our “rather poor knowledge of material properties.” The key parameter is viscosity, which depends heavily on factors such as the size of crystal grains. Laboratory experiments cannot fully replicate the conditions at these depths, which may mean current assumptions are some distance from reality. Improvements may come from simulations based on quantum-mechanical models of the crystals on which some researchers are now working.
Such details are important for the ice sheet lying close to another prodigious geoid low under the Ross Sea off Antarctica. The underlying rock’s viscosity will play a role in how the ground will rise as climate change melts the continent’s glaciers. The resulting change could cause the remaining West Antarctic ice sheet to collapse.
Despite the lack of hard data on viscosity and other parameters, simulations of variations in rock composition have replicated geoid anomalies, and the numerical techniques are helping to construct plausible scenarios of how geoid anomalies form.
Attreyee Ghosh, a geophysicist at the Indian Institute of Science (IIS) Center for Earth Science, and IIS research student Debanjan Pal built a computer simulation that played back the geological evolution of the Indian Ocean area over the past 140 million years to see how this anomaly could have formed. To deal with uncertainties in material properties, they did it 20 times, each time varying conditions such as density and viscosity in order to find the closest match to both the geoid low itself and that of the whole Earth.
“Using million-year time steps, we ran each of those simulations forward in time until the present day,” Ghosh says.
To identify the source of both the dense lower layers and the hot pool needed to emulate present-day conditions, the simulation needed to match the path of the Indian tectonic plate as it separated from the supercontinent of Gondwana at the start of the period and ultimately closed the Tethys Ocean that used to lie between India and Eurasia in order to form the Himalayas. That data came from the analysis performed by geologists over many years of the magnetic orientation of iron atoms in the rocks that solidified from the magma welling up from the rift that continues to push the Indian continental plate forward. That orientation changed not just because the plate moved and rotated, but because the Earth’s magnetic poles have wandered over the past 140 million years.
But it is an incomplete record.
“In some places, in some of the ocean, they’re very well preserved. But in others, they’re not preserved so well,” Ghosh explains. “So the largest uncertainty is in these plate-reconstruction models. If you get your plate velocities and motions wrong, then you would get your convective circulation wrong.”
The simulation pointed to the floor of the ancient Tethys Ocean being forced down into the mantle as magma formed the new Indian Ocean behind the plate. Over tens of millions of years, this cold, dense crust fell deep into the mantle and in doing so effectively pulled more of the hot and more fluid rock from deep in the mantle. “What we are showing with this modeling is that, as the plate moved northeastwards, this plume from got stretched or bent so that hot material moved into the Indian Ocean region,” Ghosh says.
Steinberger says though the plume’s origin remains far from certain, he agrees the simulation’s suggestion that it originated deep below Africa seems the most feasible geodynamically. Recent simulations of the Ross Sea anomaly by Steinberger and colleagues suggest a similar arrangement of low- and high-density rock, but there is no obvious source of a plume that can provide the hot, more fluid material. The presence of one seems likely. Steinberger points to volcanism in Mount Erebus and rising magma around the region, “which makes it more likely that there is a plume, or at least hot mantle, directly beneath,” he says.
Further time-step simulations may identify where plumes might originate and how the lower dense rock accumulated. Yet at the same time, geophysicists want more and better data to fine-tune their models and directly identify buried features. The best information on individual features comes from the shock waves produced by earthquakes. These waves slow down as they ripple through material that is hotter, which should include plumes. The dense remnants of crust from long-buried ocean floors should have the opposite effect. But the images produced by analyzing the waves received at seismic monitoring stations around the world are not reliable enough to identify possible plumes and crustal remnants clearly.
One way to wring more value from the scarce data is to combine different sources in a coherent model and to use additional mathematical treatments of the gravity readings. The rate at which gravity changes as detected from orbit can provide more information about the distribution of mass than simply relying on the basic geoid. That more-detailed information can help confirm changes in density indicated by seismic tomography.
The European Space Agency (ESA) has sponsored a series of efforts in this direction, amid other efforts to merge data sources. One recently completed project called WINTERC-G aligns gravity field analysis and seismic tomography in a unified model for the crust and the top 400km of the mantle. The next step for the ESA is the ambitious 4D Deep Dynamic Earth program, which aims to create a digital twin of the whole Earth, from the core to the crust.
“We are not just looking at the conventional datasets like gravity field and [seismic] waves,” says Bart Root, assistant professor of astrodynamics and geodynamics at the Netherlands’ Delft University of Technology and one of the lead investigators on the ESA project.
The team is looking to incorporate novel techniques, such as changes in the gravity field over time. Analysis by Root and coworkers of measurements from Mars missions has shown that, with sufficiently sensitive readings, it is possible to gauge the viscosity of material in the mantle under volcanoes. The ESA plans to launch a new generation of satellites later this decade that have the required sensitivity to monitor Earth.
The satellites that deliver the Global Positioning System can help. Researchers such as Harriet Lau, assistant professor at the University of California at Berkeley, used their signals to measure tidal distortions caused by the Sun and Moon moving relative to the Earth. Work by her and colleagues has uncovered dense anomalies lying on the core-mantle boundary that may play a role in how deep mantle plumes rise from that region. Further help could come from another group of satellites deployed to measure changes in Earth’s magnetic field caused by movement of the outer core against the lower mantle.
“It is work in progress,” Root says. “But we are finding some new and interesting ideas about the deep mantle and its role in the dynamic Earth.”
Further Reading
- Pal, D. and Ghosh, A.
How the Indian Ocean geoid low was formed,
Geophysical Research Letters, 50, e2022GL102694 (2023).
10.1029/2022GL102694 - Steinberger, B., Grasnick, M.-L., and Ludwig, R.
Exploring the Origin of Geoid Low and Topography High in West Antarctica: Insights from Density Anomalies and Mantle Convection Models, Tektonika, Vol. 1 No. 2 (2023), 10.55575/tektonika2023.1.2.35 - Lau, H.C.P., Mitrovica, J.X., Davis, J.L., Tromp, J., Yang, H.-Y., and Al-Attar, D.
Tidal tomography constrains Earth’s deep-mantle buoyancy, Nature, 551, 321-326 (2017), 10.1038/nature24452 - Root, B.C., Sebera, J., Szwillus, W., Thieulot, C., Martinec, Z, and Fullea, J., Benchmark forward gravity schemes: the gravity field of a realistic lithosphere model WINTERC-G, Solid Earth, 13, 849–873 (2022), 10.5194/se-13-849-2022


Join the Discussion (0)
Become a Member or Sign In to Post a Comment