Prologue
This blog was written before October 7, 2023, the day on which Israel’s war on Hamas broke out, the day on which reality in Israel changed. On that day, the social protest that had been taking place in Israel since January 2023, on which I focus in this post and the next one, came to a grinding halt.
Nevertheless, these contents are relevant even now, and a great deal may be learned from them for the future as well. Beyond the data science perseptive on this social protest, as presented in this and the next post, the social protest created a social (human and technological) infrastructure, whose contribution to the current war is significant and crucial.
With deep sorrow, I dedicate these posts to all of the people who were murdered, killed, kidnapped or are still missing. I also dedicate them to the brave people of Israel who are fighting for its future as a democratic and Jewish state, based on the values set out in our Declaration of Independence.
To maintain the spirit of the social protest, I have left the blogs in the present simple tense.
Introduction
For the past nine months, since January 2023, a fascinating ritual has been taking place throughout Israel. Every Saturday night, about a quarter of a million of Israel’s approximate 10 million citizens (a proporation that would be the rough equivalent of 9 million people in the U.S.) gather to protest against the changes in the regime system that the current government is trying to implement. The demonstrations take place at about 150 locations all over Israel: at the centers of cities, on bridges over highways, and at major junctions. As a social ritual, the protest has attracted the attention of many nations around the world that have experienced or are expected to experience similar events; it attracted my attention from its very beginning. I could not overlook the dedication of so many people in repeating this ritual every Saturday night and began analyzing it from different perspectives. On June 19, 2023, I shared one such examination with the readership of the BLOG@ACM, an analysis of the protest from the perspective of exponential organizations.
The routine protocol of the Israeli weekly protest begins with a welcome message from the moderator or master of ceremony, which usually starts with “Shalom (hello) <PLACE>” (e.g., “Shalom Kaplan” or “Shalom Horev”—major locations of the two biggest demonstrations in Tel Aviv and Haifa, respectively, or “Shalom Netanya” – the name of the city), followed by some acknowledgement related to the importance of the audience’s participation in the demonstration to support Israel’s democracy. Then, the audience sings the Israeli anthem HaTikva, followed by 3-4 speeches and several musical interludes.
Since, as a ritual, a lot of data is gathered on a regular basis (both intentionally and unintentionally) of the many issues associated with the current social protest, it was natural to focus my current exploration on the data science perspective, highlighting the challenges of data science expressed in this protest.
In this post, I illustrate three data-related challenges: the application domain, interdisciplinarity, and data versatility. In my next post, I will discuss challenges involved in the various steps of a data science process. In addition to lessons that can be learned for social protests (here in Israel and elsewhere in the world), I propose that the data gathered on this ritual be used for data science education purposes, as it raises many issues that are often addressed (sometimes theoretically) in data science programs.
The challenge of data
The application domain
Data science is an interdisciplinary field that integrates computer science, mathematics, and statistics, and an application domain from which data is taken and analyzed using expertise in that application domain. See Figure 1.
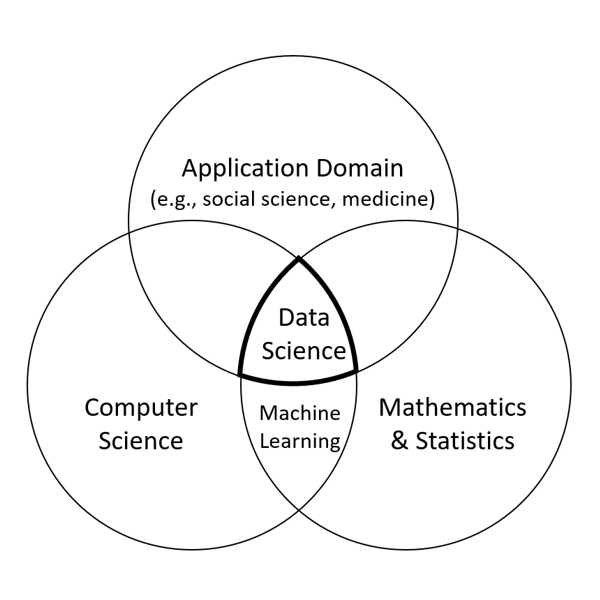
Figure 1. The data science Venn diagram.
(Credit: Hazzan and Mike, 2023, inspired by Conway, 2010)
In the case of social protest, the application domain clearly belongs to the social sciences, and more specifically to the topics of social movements, non-violent resistance, and conflict resolution. Within these research topics, however, special expertise is needed. For example, the analysis of speeches given in the demonstrations belongs to the area of rhetoric, which is “the art of persuasion, which along with grammar and logic, […] aims to study the techniques writers or speakers utilize to inform, persuade, or motivate particular audiences in specific situations.” Thus, for example, speeches can be analyzed from the perspective of the rhetorical triangle, an approach I demonstrated in the context of data science in a co-authored blog post published February 22, 2022. In this context, we can ask what side of the triangle is most used in these speeches? Has the weight of each side of the speeches’ rhetorical triangle changed throughout the protest? If so, what do these changes tell us about the protest? If not, why? What is the impact of each side of the rhetorical triangle when it is integrated into these speeches?
Other relevant fields for the analysis of data gathered during the protests are art, artificial intelligence, online communication, education, history, management, and economics, to list a few. If this data is used in data science education, a fascinating discussion can take place about the relevance of data science for the exploration of each such field.
This wide range of application domains to which the data is connected was reflected in a conference we organized at the Technion on September 11, 2023 entitled “Protest 2023 – Preliminary Research Discourse,” whose purpose was to draw more attention to the research on the social protest taking place in Israel, as part of the extensive research done on civil resistance (e.g., Chenoweth and Stephan, 2011). The papers presented at the conference addressed the emotional aspects of the protest on the individual and professional levels, the Israeli society, designated groups in the protest, and longitudinal research works extending from the COVID-19 crisis up to the current social crisis.
Interdisciplinarity
The research on social protest is not only multidisciplinary (that is, connected to and explorable from different angles independently), but also interdisciplinary. For instance, consider the research that analyzes speeches given in the demonstrations through the lens of the rhetorical triangle (mentioned above) using NLP methods. Other examples of interdisciplinary research topics related to the current Israeli social protest are the effect of the demonstration’s visual elements (e.g., flags, placards, and shirts) and vocal elements (e.g., new songs that keep delivering the protest messages) on the protesters’ motivation and feelings, and the impact of the social protest on the education system and on the training of teachers.
Such an interdisciplinary perspective not only invites researchers from a variety of disciplines to explore the protest, but also fosters collaboration between researchers and students from different domains. In the case of data science education, the exploration of each such research topic may use the skills of computer science and data science students mainly, but not only, to apply different algorithms and data analysis approaches. Such collaboration with students from other disciplines will prepare the data science and computer science students for the future work market in which interdisciplinary thinking and collaboration skills are crucial.
Data versatility
Different kinds of data are being gathered in the Israeli social protest, including text, audio, and visual. Furthermore, each kind of data is being gathered, using a variety of tools, by many people from different professions and with different expertise, who store them in different locations. Here are several examples:
- Visual objects: In addition to the usual documentation of clips and photos by the crowd, photos and clips are captured by drones (see, e.g., in Tel Aviv on July 15, 2023 and in Jerusalem on September 11, 2023). These drone photos and many others are taken by 130 drone operators who are all members of the “protest patrol” that has been documenting the protest throughout the entire country from its very beginning. Among other purposes, these drone photos are used for crowd counting at the largest demonstrations in Israel, using a dedicated AI application developed by Shai Kurianski.
- Numerical data: Every Saturday night, Professor Karine Nahon collects data that refers to the number of protesters at each of the about 150 locations and distributes it through her WhatsApp group. This data is used for various purposes, such as to illustrate how specific political and social events are reflected in the number of protesters in the weekend demonstrations.
- Text objects: Even the textual data of the speeches reflects the data versatility of the protest. In addition to speeches delivered on Saturday nights in huge demonstrations that take place in the big cities, which the protest headquarters reviews and approves them (or not) in advance, speeches are also given in a variety of other places: from smaller but organized and orderly demonstrations to spontaneous gatherings in which improvised speeches are delivered in a Hyde Park style.
- Organizational data: About 200 organizations are participating in the protest. A lot of data can be gathered and analyzed about them to understand the spirit of the protest. Whether data has already been collected about them or not, their characteristics should be considered: When were they established: prior to the protest? During the protest? What is their mission? Who are their members? What is their organizational structure? What is their contribution to the protest?
- Personal data about the protesters: So far, the data mentioned above has not addressed the individual level: the protesters. Once again, the data that can be collected about them is also very rich and can include demographic data, motivational factors for their participation in the protest, participation patterns, and more and more.
As can be seen, the data gathered in the Israelis social protest raises many challenges that any data science process that will be applied for its analysis will have to deal with. In my next post, I will explore these challenges that the data science process will have to cope with, when applied on these mountains of data.
Acknowledgement
I would like to thank Dr. Orna Agmon Ben-Yehuda, Dr. Avital Binah Pollak, Dr. Yael Rivka Kaplan, Ronit Lis Hacohen, Dr. Koby Mike, Professor Karine Nahon, Mr. Yair Palti, Professor Sivan Toledo and Dr. Uri Zakai for their collaboration and thoughts on various issues related to data collection and analysis related to the current Israeli social protest.
References
Chenoweth, E. and Stephan, M. (2012). Why Civil Resistance Works: The Strategic Logic of Nonviolent Conflict, Columbia University Press.
Conway, D. (2010). The Data Science Venn Diagram, Datist, http://www.dataists.com/2010/09/the-data-science-venn-diagram/
Hazzan O. and Mike, K. (2023). Guide to Teaching Data Science – An Interdisciplinary Approach, Springer.
Orit Hazzan is a professor at the Technion’s Department of Education in Science and Technology. Her research focuses on computer science, software engineering, and data science education. For additional details, see https://orithazzan.net.technion.ac.il/.


Join the Discussion (0)
Become a Member or Sign In to Post a Comment