Companies can no longer rely on just their internal competencies. They must complement their own competencies with those of other firms through alliances, partnerships, and digital relationships. Google, by opening its mobile Android platform to manufacturers and developers, has become the leading apps provider in the mobile space. These multifaceted interdependencies create complex connections, or ecosystems, that affect and are affected by multiple stakeholders such as suppliers, distributors, outsourcing firms, makers of related products or services, and technology providers.3 Competition today is between ecosystems. Understanding ecosystems can then help managers improve strategic decisions and reshape the boundaries of their industries. Interpreting this network of interactions, however, can be difficult. For example, a nascent ecosystem like the Internet of Things (IoT) has no dominant player and is increasing in scale, scope, and complexity.4 Under these circumstances, companies can have difficulty determining the most effective business opportunities.
We describe a graph theoretic visualization method to help companies map relationships between ecosystem stakeholders. To visualize ecosystems effectively, many entities, activities, and tools are required. Capturing, generating, and interpreting ecosystems requires a sponsor who wants to learn more about a company, a technology, or an industry, data scientists to collect salient data and prepare it for analysis, visualization tools, and a domain expert to interpret the visuals and make recommendations. Finally, companies must manage the data, visuals tools, and lessons learned in order to be effective.
A Visual Approach
Decision makers that want to visualize ecosystems need a structured approach and several visual representation methods can be used.1 The methodology consists of steps discussed here. This approach is not linear; there are many feedback loops between the stages. Progress is guided by human decision making along the way. We use The Internet of Things (IoT) as an illustration of this methodology.
Determine industry structure: Think of an industry as a company, its complementors and competitors. Identify the value chain or stacks of activities that deliver something of benefit to customers. These are inferred from industry publications and company websites. Industry structure helps the analyst identify the companies that are the major platform companies in an industry. For the IoT industry, the stack shown in Figure 1 is an illustration based on current industry consensus. Refinements to the stack can be made as new companies emerge. An independent list of available platforms can be collected from trade publications and mapped onto the stack.
Identify companies and their attributes: Platforms are important to technology-centric industries.5 Identifying platform companies for the ecosystem can be done by searching articles in industry publications. Use Internet search engines, news portals, socially curated news websites, or social media sources to locate these articles. Industry publications complemented with discussions with practitioners identified 34 platform companies for the IoT ecosystem. Lists can be augmented by semiopen sources such as Crunchbase or Angel.co or paid services such as Dun & Bradstreet, DataFox, and CB Insights. Once finalized, the analyst can visit each company’s website to identify listed partners that provide services or components for platforms and document dependencies. Most company websites list strategic alliances or partners, and describe the types of relationships (for example, technical, marketing, licensing, and so forth) and content (for example, date formed, nature, and other characteristics).
Finalize semantics for nodes and dependencies: Based on the data collected so far, the analyst can prepare it for visualization. Some software requires explicit specification of the visual encodings of nodes and edges (including the attributes that drive color, shape, size, and dependencies), and particular consideration to data type (that is, quantitative, ordinal, categorical). More recent software packages (for example, Tableau, Gephi, ecoxight) allow dynamic selection of attributes and assignments. Node sizes are usually based on a company’s revenue or number of employees. Dependencies are often color coded, based on relationship.
Visualize, analyze, and interpret: The visualizations in the figures in this column use Gephi, an open source graph visualization tool.2 Many visualization packages offer different network layout algorithms. Most commonly used are derivations of force-directed layouts, in which prominent nodes are drawn in the center and less prominent ones are pushed to the periphery. Nodes close to each other have stronger associations. After visualization, the sponsoring organization can be asked for feedback to determine if they have any insights about companies in key network positions or clusters of interest, find any surprises, and identify companies that did not make the list. Corrections are incorporated in subsequent analysis. This iterative process creates confidence in the visualizations.
Interpreting the Visualization
As noted, the IoT is a complex ecosystem not yet dominated by any single player. In Figure 2, platform companies are the red-colored circles and component providers are the gray-colored circles. Dependencies between platforms and components are shown as links. This visualization can be used to identify key players and determine business opportunities.4
Alliance Strength. Density of connections, number of partners, and network centrality all provide a sense of the resources available to any given firm that serves as an axis. In Figure 1, it’s easy to see, for example, that the Zigbee Alliance and Industrial Internet Consortium each represent an important nexus of activity. If one is a small player looking to join a winning alliance then choosing from among the bigger players could be wise. While, if one is a competing nexus, choosing compatibility with other midsize players could reshape the network landscape.
Vertical Integration. Companies that provide end-to-end solutions become vertically integrated and tightly controlled. For example, in its early days, the software industry was dominated by IBM, Digital Equipment, and International Computers. These end-to-end solutions providers fragmented into multiple companies and divided technical leadership. The IoT ecosystem (see Figure 3) reveals many clusters, suggesting they are either providing end-to-end solutions or leaving integration to the user. IBM among those three early pioneers survives today, but Bluemix (integrating IBM products and services), Kaa (providing middleware services that work with any stack), and 365 Farmnet (specialized for agricultural services) might be relevant for individual specializations and doomed from a network perspective.
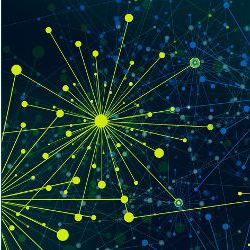
Preferential Attachment. With proliferation of platforms in the IoT ecosystem, solutions providers must select one platform over another. If they simultaneously commit to too many platforms they make significant resource commitments. In the software industry, solutions providers attach themselves to one or two platforms based on incentives, momentum or technological superiority. Here solutions providers are unsure, they can hedge their bets by selecting multiple platform. Oracle built huge market share by supporting multiple platforms like Windows and Linux. Android (see Figure 4) is preferential to IFTTT, ensuring that Android can integrate with most other products.
New Entrant and Network Effects. Major players in non-IoT industries (for example, Samsung, Apple, and Alphabet) still fight for dominance in the IoT ecosystem. To gain developers, these companies open up their IoT platforms and programming interfaces. Brand recognition, existing devices, platforms, and relationships with developers might give them an advantage. As Alphabet expands into home automation with Nest, many Google Play developers might move with it. Developer familiarity with Google’s API in one setting could also be used to develop products in other settings. A similar trend in the software industry enabled Microsoft’s strong position in operating systems to help it dominate the web browser market. In Figure 3, Apple Homekit occupies a key position in the network. With Apple’s decision to open its API, it instantly brings several hundreds of thousands of developers into the equation.
Focus on the Core. An emergent ecosystem builds infrastructure first (see the core of the ecosystem in Figure 5). Personal computers needed an operating system before the explosion of applications could occur. The IoT ecosystem needs constant monitoring. Communicating data across networks is critical. Low-power solutions and connectivity are needed in the infrastructure (see the figure showing the core of the current IoT ecosystem) to help connect devices and ensure efficiency.
The Power of Interoperability Emergent ecosystems require integration of devices and services. They also require interoperability between competing platforms. These significant challenges benefit from learning about the early days in the software industry. Application Program Interfaces (APIs) allowed firms to interact and share information with other firms, and made it easy to achieve integration and interoperability across platforms and devices. They could be used for more: APIs could track the ways users integrate services and devices, providing insights into how users derive value through a product’s use. Alphabet’s Nest has used this very effectively to implement the “Works With Nest” program. Because of this program, customers buying Nest will have the option to integrate it with the most common devices like LG washing machines or Amazon’s Echo. Nest’s position can be further solidified, if it became interoperable with highly connected platforms (as shown in Figure 3). This position gives it access to critical knowledge flows across the network.
Challenges
Visualizations can help with understanding industry structure and emergence of key players. The dynamic nature of competition makes every new entrant and every move by an existing player relevant to the topology the ecosystem changes and the competitive position of companies. Companies must constantly track nodes and dependencies in networks. Computational tools for data gathering and AI techniques for text processing and understanding can be automated so executives can focus on understanding and exploring interactive visuals. Ecosystem visualization continues to grow and mature as data scientists, graph theorists, and visualization researchers create new techniques. In this way, ecosystem visualization is likely to become ubiquitous in high-velocity business environments.


Join the Discussion (0)
Become a Member or Sign In to Post a Comment