The common stumbling block of all Big Data problems is how to digest all that information in a way that achieves the goals of those who collect it. Visualization is often cited as the answer — allowing an individual to take in wide swaths of data at a glance—but when you have terabytes of information, it takes too long to visualize it all, especially when the patient is lying on the operating table.
To visualize the most important aspects of data in real time is the self-imposed mission of Valerio Pascucci, a professor in the Scientific Computing and Imaging Institute of the School of Computing at the University of Utah, and co-creator of Visualization Streams for Ultimate Scalability (ViSUS).
Pascucci earned a master’s degree in electrical engineering from the Sapienza University of Rome, Italy, in 1993. He moved to the U.S. in 1995 and earned a doctorate in computer science from Purdue University, which he received in May 2000. He later became Group Project Leader at the Center for Applied Scientific Computing at Lawrence Livermore National Laboratory (LLNL), as well as an adjunct professor of computer science at the University of California, Davis. It was at LLNL that he got the idea for ViSUS, and after moving to the University of Utah, he and colleagues fully developed it. LLNL and University of Utah jointly hold the first patent on ViSUS, and three newer patents have been filed by the University of Utah alone, one of which has been granted.
Originally developed to permit the interactive editing and analysis of massive (more than a gigapixel) images, ViSUS has graduated to rendering three-dimensional (3D) images from data garnered from everything from space probes to computer tomography (CT) scans of the human brain.

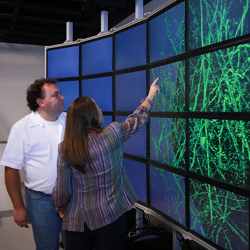
A ViSUS visualization of data on the cosmic scale on a super-high-resolution
display wall at King Abdullah University of Science and Technology
in Thuwal, Saudi Arabia.
Credit: National Aeronautics and Space Administration
“ViSUS’ significance is not in creating the preview, but in allowing an editor to zoom in on any part of the low-resolution panorama and quickly see and edit a selected portion of it at full resolution. Older software required the full-resolution image to be processed before it could be edited,” Pascucci explained. “Normally, the amount of memory used in a computer to edit and preview a massive image would have to be large enough to handle the entire data set for that image. In our method, the preview has a constant size, so it can always fit in memory, even if the fine-resolution data keeps growing.”
The first step for utilizing big data in ViSUS is to reformat in into InDex Format (IDF) in real time; then ViSUS takes over, eliminating the tedium of converting terabytes into megabytes for display.
“What used to take days or weeks can now be done in minutes and it does not require a supercomputer; you can render data on almost any platform, even iPads or iPhones,” Pascucci said. “We don’t waste time by analyzing data while it is being acquired, but change the way data is stored as it is acquired to minimize the amount of data needed for a specific-sized display. This allows the researchers to view images while the entire dataset is still downloading.”
Chris Johnson, a professor in the School of Computing at the University of Utah and director of its Scientific Computing and Imaging Institute, says the ViSUS platform “is designed with the primary philosophy that the visualization and analysis of massive data need not be tied to specialized hardware or infrastructure. In other words, a visualization environment for large data can be designed to be lightweight, highly scalable, and run on a variety of platforms or hardware.”
Johnson said the effectiveness of ViSUS “stems from the development of the mathematical concept of hierarchical space-filling curves, which introduces the opportunity of organizing large data models in a way that maximized computing performance with minimal use of specialized hardware. This result is a software infrastructure that has a unique ability to scale on a variety of platforms ranging from handheld devices such as iPhones and iPads, to large visualization servers and power wall displays, to the input/output infrastructure of massively parallel supercomputers tested successfully on up to three-quarters of a million cores (Mira and IBM Blue Gene/Q supercomputer at Argonne National Laboratories).”
“The magic that Pascucci’s ViSUS does is determining which pixel color and brightness is the most representative of a whole volume of pixels in 3D (three-dimensional) space,” said Dave Shreiner, a past chair and current treasurer of the ACM Special Interest Group on Computer Graphics and Interactive Techniques (SIGGRAPH). “Many other methods have been tried, such as averaging pixels, but Pascucci’s ViSUS has a way of rendering a stream of real-time pixels so that it is useful on any size display, which is especially useful in medicine where there are lots of applications that ‘love the detail,’ as it is said.”
Pascucci, who has patented ViSUS and its IDX data format, is reticent about revealing the details of his algorithm’s inner workings (except those he had to reveal in order to get a patent). “Indeed his algorithm is mysterious, and even more so for 3D, which is much more complicated than his earlier work in 2D,” Shreiner said. “Somehow he figures a way to preserve the representation’s details no matter how big the screen is. Even very small representations are made very quickly, even though it processes huge amounts of pixels.”
CT brain scans, for instance, are more or less parallel two-dimensional images of slices of the brain, always having more pixels than can fit on the screen and often gathering more pixels than can even be held in main memory. There are many other applications that need to analyze more pixels than can be held in memory, such as seismic imaging when looking for oil deposits, which collects huge amounts of data, but the operators want quick 3D renderings of it.
“Pascucci’s technique is very good, no matter where the data comes from,” Shreiner said. “His magic is to preserve detail while doing it in real time.”
R. Colin Johnson is a Kyoto Prize Fellow who has worked as a technology journalist for two decades.


Join the Discussion (0)
Become a Member or Sign In to Post a Comment