Abstract
Surface tension is an important property of liquids. It has diverse uses such as testing water contamination, measuring alcohol concentration in drinks, and identifying the presence of protein in urine to detect the onset of kidney failure. Today, measurements of surface tension are done in a lab environment using costly instruments, making it hard to leverage this property in ubiquitous applications. In contrast, we show how to measure surface tension using only a smartphone. We introduce a new algorithm that uses the small waves on the liquid surface as a series of lenses that focus light and generate a characteristic pattern. We then use the phone camera to capture this pattern and measure the surface tension. Our approach is simple, accurate, and available to anyone with a smartphone. Empirical evaluations show that our mobile app can detect water contamination and measure alcohol concentration. Furthermore, it can track protein concentration in the urine, providing an initial at-home test for proteinuria, a dangerous complication that can lead to kidney failure.
1. Introduction
Mobile computing has recently seen a surge in research on inexpensive methods for measuring liquid properties and identifying liquid type.7, 12, 17, 21 The developed methods can detect water contamination and distinguish a variety of liquid types such as water, milk, oil, and different alcohol concentrations. The goal of this line of research is to enable liquid testing outside the lab environment and encourage ubiquitous applications. However, the proposed designs require a specialized setup (a robot,21 a special container,7 etc.) and use devices typically unavailable to the general population (e.g., UWB radios or RFID readers). Although they make an important step toward ubiquitous liquid testing, they are still difficult to use by lay users.
This paper asks whether it is possible to deliver such services to lay users without a specialized setup, and using only a device that almost everyone has: a smartphone. Answering this question is not simple. Typically, liquid testing is done by measuring a particular property, such as electric permittivity or optical absorption, and using the measurements to identify the liquid type and characteristics.7, 12, 17, 21 However, none of the properties used in past work can be measured with a smartphone. To address this problem, we explore an alternative liquid property, surface tension, and develop algorithms and system architectures that enable measuring surface tension using only a smartphone.
Surface tension characterizes the force that holds the surface molecules together and minimizes the surface area. Measuring surface tension can reveal water contamination and allow for distinguishing liquid types.19 Water has a relatively high surface tension, and when polluted with organic compounds such as bacteria, oil, petroleum or its derivatives, its surface tension decreases significantly.3, 19 Hence, one may use this property to detect water contamination. Further, lipids and proteins act as surfactants, that is, they reduce surface tension. Alcohol also reduces surface tension, a property that can be leveraged to measure alcohol concentration.20 Most interestingly, the ability to measure surface tension at home can enable early detection of medical problems. For example, low surface tension of urine may indicate the presence of excess protein, a dangerous complication in diabetes patients.8 Daily measurements of urine surface tension help detect diabetic nephropathy (the chronic loss of kidney functions) and monitor the effect of treatment.8
Today, measurements of surface tension require a device called tensiometer, which typically costs thousands of dollars.9 They are often conducted by dipping a platinum plate into the liquid and carefully measuring the force required to pull it out. The process is complicated and requires professional training.9 This high bar hampers the ubiquitous application of surface tension.
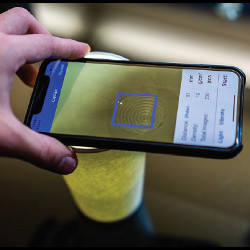
We introduce CapCam (Capillary Camera), the first mobile app that measures liquid surface tension using only a smartphone. To measure surface tension, the user places the smartphone on top of a lightweight container, such as a paper cup, and activates the app, as shown in Figure 1. The phone vibrates and forces the container’s wall to vibrate. The vibration generates capillary waves on the liquid surface, that is, small waves whose wavelength characterizes the liquid’s surface tension. Our app uses the flashlight camera to take a few photos of the liquid, which it processes to estimate the capillary wavelength and hence the surface tension. Our approach is accurate, simple, cheap, and accessible to any user with a smartphone.

Figure 1. CapCam setup: the phone is placed on a paper cup. Capillary waves are generated by the vibro-motor inside the smartphone. Then with the flashlight, the camera of the phone can capture a bright-and-dark pattern, from which we can calculate the surface tension of the liquid.
Measuring capillary waves just using smartphones is quite challenging for two reasons. First, the waves are very shallow1; simply trying to image them at the liquid surface does not yield accurate results. Thus, instead of imaging the capillary waves directly, we image their reflections at the bottom of the container. We model the small waves on the surface as a series of convex and concave lenses. When illuminated with the flashlight on the phone, the lenses focus the light and create a pattern of bright and dark rings on the bottom of the container. The focusing effect of the small lenses makes this pattern much higher contrast than the waves on the surface, and hence easier to capture and characterize using a camera.
The second challenge stems from the camera rolling shutter. Phone cameras do not capture images in one snapshot; they capture a picture by sequentially scanning rows of photo diodes.14 As the waves are moving, the sequentially scanning creates motion artifacts in the captured image. If uncorrected, these artifacts can lead to large measurement errors. CapCam addresses this problem by recognizing that the direction orthogonal to the scanning direction is not affected by motion artifacts; it processes the image to identify this orthogonal direction and uses the line of pixels along that direction to measure capillary waves.
We have implemented CapCam on an iPhone X and evaluated its performance by comparing its output against that of a high-end digital tensiometer. Our evaluation shows that CapCam accurately measures liquid surface tension using only a smartphone. Specifically, CapCam has an averaged absolute surface tension error of only 0.75 mN/m. In comparison, an entry-level manual tensiometer13 has a resolution of 0.5 mN/m, costs several thousand dollars, and requires expert knowledge. CapCam has enough resolution to detect small differences in alcohol concentration of 0.5%, whereas past work is limited to large differences of 20% for Nutrilyzer17 and 25% for RFIQ.12 CapCam’s resolution allows it to easily detect water contamination and it also has enough sensitivity to track changes in protein levels in urine as they transition from healthy to dangerous levels, providing an initial at-home test of proteinuria.
Contributions: this paper makes the following contributions:
- It introduces CapCam, the first design that estimates liquid surface tension using only a smartphone, without any specialized hardware. CapCam is also the first mobile app that detects water contamination, measures alcohol concentration, and tracks changes in protein levels in urine.
- It presents two novel algorithms: (1) an algorithm for inferring capillary wavelength by creating a characteristic pattern on the bottom of the container, and (2) an algorithm for characterizing the impact of rolling shutter on capillary waves and eliminating the resulting measurement errors.
- It provides an implementation and empirical evaluation that demonstrate the efficacy of the proposed design.
2. Related Work
 2.1. Liquid testing in mobile and ubiquitous computing
The topic of liquid testing has recently attracted significant interest.7, 12, 21, 23 Most proposals try to infer electric permittivity,7, 21, 23 a property that characterizes how a liquid affects radio waves. For example, TagScan21 and LiquID7 measure the time delay and power attenuation incurred by an RF signal as it traverses the liquid of interest. Their approach requires a complex setup (a moving robot, or a particular container) and uses special radios not typically used by lay users. Further, as RF attenuation and phase are highly sensitive to liquid depth, these systems have to be carefully calibrated. As a result, these methods either exhibit relatively large errors (10% in LiquID7) or they avoid measuring exact values and resort to classifying the liquid as one of a few known types (as in TagScan21). There are also proposals that identify liquids using RF coupling, as in RFIQ,12 or RF reflections as in RadarCat.23 They too use special radios (Soli or RFID readers); further they rely on a classifier to distinguish a few liquid types or a few concentration levels and do not generalize to unseen liquid types or concentration levels.
Some proposals rely on optical absorption. Specifically, when shining intensity-modulated light on a liquid, different liquids produce uniquely different sound spectra. These solutions require custom hardware and have a relatively limited resolution. For example, by analyzing the received spectra, Nutrilyzer17 can predict alcohol concentration level with a limited resolution (20%).
CapCam is inspired by the above work, but focuses on liquid testing using a smartphone, a device that almost every user has.
2.2. Measuring surface tension
Today, surface tension is measured in the lab using an expensive device called tensiometer. There are four common types of tensiometers: force-based (e.g., Wilhelmy plate), pendant-drop-based, contact-angle-based, and capillary-waves-based. Although tensiometers can achieve high accuracy, expensive instruments and sophisticated measurement procedures prevent their ubiquitous use. In comparison, CapCam extends the model based on capillary waves to allow a nonexpert user to measure surface tension using only a smartphone.
Although some past work has attempted to measure surface tension using a smartphone, all past proposals require additional complex hardware, and none is able to complete the measurements with only a smartphone.4, 5, 11, 22 Specifically, the work in Wei et al.22 uses a cellphone camera to capture images of capillary waves. However, it ignores the rolling shutter effect, which leads to poor performance. Further, it requires custom hardware where a large container is elevated between two stands although projecting light from the bottom, a signal generator that excites the liquid, and a paper screen held on top of the surface. The proposals in Goy et al.11 and Chen et al.5 use cellphone cameras to capture images of a drop of liquid. Their method requires specialized equipment to exercise tight control of the drop’s size and shape. It also requires extreme cleanliness and a complex measurement procedure making it hard to conduct by nonexperts. Similarly, the method in Chen et al.4 requires custom hardware to control the size of the liquid drop as it touches a special solid surface.
CapCam builds on the above work. However, unlike these methods, CapCam can measure surface tension simply using a smartphone app without any special hardware. Further, it can be operated by an average user without any training.
3. Capillary Waves Primer
In this section, we provide a primer on capillary waves and their relation to surface tension. For waves propagating on a fluid surface, gravity (g) and surface tension (γ) are the forces that make the liquid restore at surface. Those forces control the dispersion relation of the wave, which relates its wavelength (λ) to the vibration frequency (f) and liquid density (ρ), and can be expressed by the following equation (see Chapter. 16 of Blandford2 for a detailed derivation):

When the waves are large, such as those observed on the surface of a lake, they are dominated by the gravity term g and referred to as gravity waves. When the waves are small, the effect of gravity is negligible, and the waves are dominated by surface tension γ; they are called capillary waves.
We can re-order the terms in the above equation to measure surface tension as follows:

This equation provides a procedure for measuring surface tension using capillary waves. Specifically, we can use a vibration source to generate capillary waves on the liquid’s surface. Knowing the vibration frequency f, we can substitute the gravity term and the liquid density from the corresponding data sheetsa. Hence, all we need is to measure the wavelength λ in order to measure the surface tension.
The challenge however is that capillary waves are very shallow, that is, the displacement they cause in the liquid surface is one to a few microns. This is about one tenth of the average thickness of a human hair. Thus, such waves are invisible and their measurement typically requires dedicated laboratory equipment24 with a complicated setup and procedure. In the rest of this paper, we describe CapCam, a novel design that can measure capillary wavelength using only a smartphone.
4. Capcam Design
CapCam measures surface tension using a phone’s camera, flashlight, and vibro-motor. The process is very simple. The user places the smartphone on top of the container (e.g., a cup) and activates the CapCam app, as shown in Figure 1. CapCam uses the phone’s vibro-motor to generate capillary waves on the liquid surface and then takes a few photos of the vibration pattern using the phone flashlight camera. It uses a series of algorithms to process these photos to infer the capillary wavelength and hence the surface tension.
CapCam’s inference algorithm addresses the challenge of measuring very shallow capillary waves and makes it possible to measure the wavelength with only a smartphone. In this section, we describe the model and analysis underlying CapCam’s wavelength inference algorithm. We describe how we deal with phone hardware in the next section.
4.1. CapCam’s wavelength inference algorithm
We model the crests and troughs of capillary waves as a series of convex and concave lenses. By shining a flashlight on the waves from the top, we can create a visible pattern that reflects off the bottom of the container. Specifically and as shown in Figure 2, when the light goes through a wave crest, it is focused into a small area on the bottom of the container. On the other hand, when the light goes through a wave trough, it diverges causing a dark region on the bottom of the container. This results in a series of bright and dark rings on the bottom of the container.

Figure 2. An cross-section illustration of the setup. Because of refraction, light rays are focused/diverged by the crests/troughs of the waves, resulting in a series of dark and bright rings on the bottom.
If we try to capture this pattern using a smartphone, the camera would see only the reflections that exit the liquid surface and propagate through air toward the camera. However, due to reciprocity, light reflected from the bottom toward the surface experiences the opposite effects of light entering the surface from air, that is, light rays from the bright rings will diverge and light rays from the dark rings will converge. Hence, if the camera is exactly at the same position as the flashlight, it will not see any pattern. However, the camera is never at the exact same location as the flashlight, and the light rays that it receives do not trace the exact path of the incoming light. As a result, the focus and divergence effects that the light experienced although traversing the surface from air to liquid do not get cancelled as it traverses the surface from liquid to air. Therefore, the pattern continues to be visible to the camera albeit at lower contrast.
After we take an image of the pattern at the bottom of the container, we measure the distance between two consecutive bright rings in terms of pixels, denoted as p. We need to convert p from pixel-based distance to real distance. Of course, this depends on the distance between the camera and the bottom of the container, which we denote as d + h, where d is the distance between the camera and the surface of the liquid, and h is the depth of the liquid. Let us use rd+h to refer to the resolution of the camera for objects at distance d + h. Then, we can convert the distance between consecutive bright rings in the image, p, into real distance, λb, as follows:

Next, we want to use the interval between two bright rings to estimate the capillary wavelength. To calculate the relationship between the two, we approximate the surface waves as perfect lenses; when the incident ray goes through the center of a lens, its direction is unchanged, as shown in Figure 3. Thus, the relation between the capillary wavelength λ and the interval between two bright rings, λp, is

Figure 3. An illustration of the wavelength calculation. We plot only the rays that pass through the center of the crests of the waves, which do not bend.

Combining the two equations, we have

As camera resolution is inversely proportional to distance from the imaged object, we have

Therefore, we can rewrite Equation (5) as follows:

where p is the number of pixels between two consecutive bright rings, and rd is the camera resolution for objects at distance d, that is, at the liquid surface.
Equation (7) and the model underlying it provide us with an algorithm to compute the capillary wavelength. They also show that we only need to measure the distance between the camera and the liquid surface and use the corresponding resolution to convert the inter-ring pixels in the image to the actual capillary wavelength.
Note that, it is enough to calibrate the camera resolution at one default distance based on Equation (6). The resolution r at distance d can be computed as

where r0 is the resolution at the default distance d0.
To provide a better visual understanding of CapCam’s algorithm, we build a simulator based on ray tracing. The surface of the liquid and the bottom of the container are discretized into dense pixels. Our simulation can be divided into two phases. First, the light source emits light rays onto each pixel on the surface, and for each light ray, we calculate its location of arrival at the bottom of the container. Then the intensity of each bottom pixel is set to the total number of rays falling on that pixel. In the second phase, we densely sample locations inside each pixel in the camera and trace the light rays that fall on the camera to their origin on the bottom of the container. This allows us to obtain the set of pixels on the bottom of the container that are reachable from that camera pixel. The intensity at each camera pixel is set to the sum of the intensity of all reachable bottom pixels.
We show the results of a simulated experiment in Figure 4. By comparing Figure 4d with Figure 4e, we can see that the peaks of the pattern on the bottom of the container are much sharper than the crests of the capillary waves at the surface. This is because the crests of the surface waves focus light into a series of much narrower bright rings at the bottom of the container, therefore increasing the contrast. Also by comparing Figure 4f with Figure 4e, we can see that troughs of the pattern captured by the camera are distorted and the peaks are shifted to the left. This is because the slight separation between the camera and the light source which causes the camera to see the pattern from its own angle. But still, we can use the imaged pattern to calculate the wavelength accurately using Equation (7). In this simulation, the camera has a resolution of 40 pixel-per-millimeter at the surface distance, and the wavelength is 3 mm. At these values, and assuming the liquid is water, the wavelength is exactly 120 pixels.

Figure 4. A simulated experiment showing the relation between the waves on the surface, the pattern on the bottom of the container, and the captured image. Figures on the second row show the pixel value along the yellow line in the corresponding first row figure. Comparing (d) with (e), we see that the crests of the pattern on the bottom are both sharper and higher value than the crests of the waves on the surface. This is due to the focusing effect on the lenses. Also note that in (f), the crests are shifted to the left; this is because the camera and the light are not co-located.
5. Dealing With the Camera’s Rolling Shutter
The algorithm in Section 4 measures the surface tension using the following: a high frequency vibro-motor that can be used to excite capillary waves, a light source to provide illumination, and a camera to capture the resulting pattern. Thankfully, a smartphone includes all three components. Thus, in principle, we can measure the wavelength in the image captured by the phone and convert from pixel-based distance into real distance using Equation (7), which gives us the surface tension. However, in practice, we still need to take care of another challenge caused by the reality of phone hardware: the camera’s rolling shutter effect.
As explained earlier, the wavelength is the distance between two consecutive bright rings. Because the rings are concentrated (see Figure 4c), we can pick a particular direction along the radius of the rings and use it to measure the distance between consecutive bright rings, which would then yield the wavelength. Unfortunately, it is not that simple. In reality, not all directions give the correct wavelength. Figure 5 shows an example image of the ring pattern due to capillary waves. The figure shows three radial directions along and the corresponding wavelength in number of pixels. The figure shows that the average number of pixels between two consecutive bright rings along these three directions is 109, 111, and 115. The differences between these estimates of the wavelength cause a significant difference in the resulting estimate of surface tension. In fact, a difference of two pixels leads to an error of 4 mN/m in surface tension, which is more than 5% of the water’s surface tension γ = 72 mN/m. This means that we have to figure out which of these radial directions yield the correct estimate of wavelength and use only that direction.
In order to pick the correct radial direction for our estimation, we first need to understand why different directions yield different distances between the bright rings, that is, different wavelengths. The reason is the rolling shutter. Rolling shutter refers to that a camera captures a picture by sequentially scanning rows of photo diodes.14 Therefore, pixels are not recorded at exactly the same instant, and because the wave is traveling rapidly, this will result in a Doppler effect.
In the example in Figure 5, the camera is scanning from right to left, and the wave is propagating from the edge of the cup to the center. The propagation direction and the scanning direction are aligned for the radius on the right (in the figure) and are opposite for the radius on the left. Thus, the measured wavelength is shorter along the left radius and longer along the right radius. As for the radius in the middle, the propagation direction of the wave is perpendicular to the camera scanning direction, and hence the measurement is not affected by the rolling shutter.

Figure 5. A sample image taken by a smartphone. The three lines represent three radii with different directions. Numbers besides the lines are the corresponding wavelength measured in number of pixels, and they are different from each other. This suggests picking wrong radii may result in a significant error.
Therefore, for accurate estimation, we want to measure the wavelength along the radius perpendicular to the camera’s scanning direction (the green line in Figure 5). Given that the camera scans images horizontally, the correct radius is along the vertical direction in the image. We can ask the user to manually pick the vertical radius. However, it is preferable to do it automatically to reduce user overhead and any potential errors. To do so, we search for the vertical line in the image that maximizes symmetry. Specifically, because the line we are looking for is a radius of the concentrated rings, the pattern on its left should be similar to the pattern on the right (i.e., the intensity of the few pixels to the left of the line is similar to the intensity of the few pixels to the right of the line). Thus, we only need to find a vertical line whose neighbor pixels are symmetric with respect to itself. This is similar to detecting reflection symmetry in images and can be solved by convolving with a wavelet filter.6 Specifically, we design a convolution filter that is -1 on the left side and +1 on the right side. When convoluting with an image, result will be close to 0 only when there is reflectional symmetry in the reception field of the filter.
The reflection symmetry is only observable when the reception field of the filter is large enough, for example, at the scale of one wavelength, which is about a hundred pixels. To increase the reception field of the filter, instead of using a big filter which is expensive, we can down-scale the image to speed up the convolution process. Then for each column in the convolved image, we calculate the sum of the absolute values of all of its pixels. Because of the property of the filter, the result in the ideal column should have the lowest value. Therefore, we select the column with minimum sum as the ideal location to measure the wavelength. Note that, in the implementation, we also average across multiple images to improve robustness of the algorithm.
This algorithm can locate the vertical radius accurately. Further, because it is based on very simple operations, it is highly efficient and can run on an ordinary smartphone.
6. User Interface and Implementation
We implement CapCam as a standalone iOS App using the Swift programming language. To speedup processing, we use Apple’s Accelerate Framework for SIMD operations such as convolution and summation. This yields a significant speedup compared to a naive Swift implementation.
Two main user interfaces of CapCam are as shown in Figure 6. The UI on the left (Figure 6a) is the configuration interface. On this interface, we introduce each component from top to the bottom. The first component is the preview of the camera. On the preview, there is a blue frame showing the area where we run our analysis algorithm. By cropping the image, we are able to achieve a much faster speed without sacrificing accuracy. Next there are three text fields. The first text field is for the user to input the distance between the surface and the camera. The app includes a ruler to assist the user in measuring the distance directly with the phone. The second text field is for the density, and its default value is 1.0. The third text field is for the user to specify the number of captured images. Having more images will increase the accuracy, yet will take a longer time. Then there is a progress bar indicating the progress of the analysis process. Finally, there are three buttons on the bottom. “Light” and “Vibrate” are the controls for the flashlight and the vibro-motor, and the “Start!” button is for starting the analysis process.

Figure 6. CapCam’s user interface.
After the analysis finishes, the app shows the analysis interface, which is the UI on the right (Figure 6b). One sample captured image is shown on the top half, with the automatically detected estimation radius highlighted. The histogram of the wavelength is plotted beneath the sample image. Finally, the estimate of the surface tension is printed out at the bottom.
7. Evaluation
In this section, we evaluate the performance of CapCam and its ability to deliver interesting applications to the user.
In all experiments, the ground truth of the surface tension is obtained by using an advanced digital force tensiometer (Dataphysics DCAT 119), as shown in Figure 7. It measures the surface tension using the Wilhelmy plate method and can provide a resolution of 0.1 mN/m (0.1 millinewton per meter).

Figure 7. Digital tensiometer with a resolution of 0.1 mN/m for measuring ground truth of surface tension (Model: Dataphysics DCAT 119).
We install CapCam on an iPhone X. Unless specified otherwise, we use a standard paper cup as a testing container and set the liquid depth to 45 mm. We place the phone on top of the cup, as shown in Figure 1. We hold the phone with our hand as shown in the figure to ensure it stays still while taking the images and does not move due to vibrations. The cup has a height of 132 mm. The camera on the iPhone is measured to have a resolution of 39.5 pixels per millimeter at a distance of 87 mm, and the vibration frequency of the iPhone is centered at 144.5 Hz. For each measurement, CapCam continuously takes 200 images. On average, each surface tension measurement takes 8 s. For each liquid sample, we repeat the measurement five times and compute the average and standard deviationb.
7.3. Detecting water contamination
Water has a relatively high surface tension, and when polluted with organic compounds such as petroleum, bacteria, pesticides, oil or its derivatives, water surface tension decreases significantly.19 In this section, we empirically evaluate the effectiveness of CapCam at detecting changes in surface tension due to such contamination. Although not all sources of water contamination change surface tension (e.g., metal contamination), our approach covers a large and important class of contaminants. Such bacterial and organic contamination is common anywhere unsanitary conditions are present. Further, people who live downstream from factories are at greater risk of contamination from petroleum and organic waste, and people in farming communities are at risk for contamination from agriculture waste.16
We compare five different water sources: (1) deionized (i.e., pure) water, (2) tap water, (3) rain water, (4) pond water from a tree pit, and (5) water left exposed for a week. Figure 8 plots the surface tension of the above water sources. The figure reveals two findings. First, by comparing the blue and red bars in the figure, we see that CapCam’s measurements of surface tension match those from the tensiometer. This shows CapCam’s accuracy. Second, the figure shows that both tap water and rain water have a surface tension similar to deionized water, which indicates that these sources of water are not polluted. On the other hand, pond water and exposed water have much lower surface tension, meaning that they contain chemicals that can decrease surface tension, which is a sign of contamination.

Figure 8. Water contamination detection. Both tap water and rain water have a surface tension close to deionized water. In contrast, pond water and exposed water have lower surface tension values due to contamination.
7.4. Tracking protein in urine
People who have diabetes or high blood pressure are vulnerable to kidney disease. When the kidney is damaged, it starts leaking substrates into urine that are not supposed to be present. Many of these substrates reduce urine surface tension. In particular, microalbuminuria is a complication in diabetic patients, where the kidney starts leaking albumin into urine.15 We would like CapCam to help diabetic patients by providing them with an easy way to regularly test the level of albumin in urine. If the level increases beyond a safe threshold, the patient can contact the doctor for more intensive tests.
We empirically test CapCam’s effectiveness at delivering this application. We add different levels of egg albuminc to a sample of healthy human urine and measure urine surface tension for different albumin concentrations.
Figure 9 shows urine surface tension as a function of albumin concentration. Note that a protein level of over 30 mg/L is the threshold at which the patient has microalbuminuria.10 The results in the figure indicate that our system can track changes in urine surface tension with increased albumin concentration in a manner comparable to a professional tensiometer. Further, it can detect when the protein concentration becomes dangerous. This means a patient can track the progress of the disease in the home using her smartphone.

Figure 9. Urine surface tension test with different protein concentration levels. For a healthy person, protein concentration level in urine should be less than 30 mg/L,10 and the greater the concentration, the higher the risk.
7.5. Measuring alcohol concentration level
We test the performance of our system on a series of ethanol solutions with different concentration levels. This is a complex scenario because an ethanol solution is a mixture of two liquids: water and ethanol. The density of the mixture ρ in Equation (2) depends on the ratio of ethanol to water in the mixture. Thus, we are facing a chicken-and-egg problem: we want to measure surface tension to estimate alcohol concentration; however, we need the alcohol concentration to estimate ρ, which we need for our measurements of surface tension.
To address this issue, we leverage the fact that both the surface tension and the density of the ethanol mixture are functions of its concentration level. Further, they are known functions available in data sheets.18, 20 Given both functions, we can compute for each given ethanol concentration level, its surface tension and its density, and take the ratio of the two, denoted as the surface tension to density ratio (TDR).
We can then rewrite Equation (2), so that we can estimate the TDR, that is, γ/ρ, as opposed to surface tension γ:

Notice that the left hand side of this equation is the TDR, and we can compute it by substituting for the vibration frequency, gravity, and the wavelength of the capillary waves, which we can compute as before. Therefore, we can first measure the TDR of the alcohol using CapCam, and then convert the TDR into the concentration level.
The measurement result for ethanol concentration level is plotted in Figure 10a. The absolute error is only 0.51%. This implies our system is accurate enough to distinguish German Riesling from Australian Riesling and Portuguese Rose from French rosés.

Figure 10. (a) Alcohol concentration measured by CapCam in blue and ground truth in orange. (b) CapCam’s resolution: differences between true and measured surface tension show that CapCam has an averaged error of 0.75 mN/m.
Next, we are interested in understanding CapCam’s resolution, that is, the expected error in its measurements of surface tension. To estimate this value, we leverage the results from the alcohol concentration experiment. Specifically, for any alcohol concentration level, there are datasheets that report the surface tension and density.20 By substituting the density ρ in the TDR equation above, we compute CapCam’s estimate of surface tension, γ, which we can compare against the true surface tension in the datasheet. The measurements are plotted in Figure 10b. On average, CapCam has a surface tension error of only 0.75 mN/m, for surface tension in the range from 33 mN/m to 72 mN/m. In comparison, an entry-level manual tensiometer13 has a resolution of 0.5 mN/m, and it still costs thousands of dollars and requires complicated procedure.
8. Discussion and Limitations
- Sensitivity: as in past work,7, 21 CapCam measures a particular liquid property and uses the measurements to make certain inferences. However, for any of these systems, the inference has to be taken within the measurement context. For example, as CapCam measures surface tension, it is sensitive to bacterial and organic contaminants but cannot sense contamination by heavy metal because they do not change surface tension. Thus, when it infers contamination, the water is certainly impure but the inverse is not necessarily true. Similarly, if it detects two liquids to be different, then they are different (assuming no measurement error), but if it cannot differentiate them, they might still be different liquids that have the same surface tension.
- Container specification: CapCam has certain requirements on the container type. First, the container should have a flat bottom. If the bottom is not at, there will be artifacts in the ring pattern, which affect the measurements. Second, the container should be relatively light so that it vibrates with the vibro-motor. Third, the current system is designed for circular containers. Waves are excited by the vibrating wall and propagate from the edge to the center. Based on the Huygens-Fresnel principle, when the wall is circular, the resulting waves are also circular, hence creating clear rings as described earlier. But if the container is not circular, the wave pattern will be much more complex. Addressing this scenario requires extending the model to account for interaction between waves that traveled different distances, which is left to future work.
- Liquid transparency: CapCam assumes that the liquid is transparent and the pattern at the bottom is visible from the surface. Many liquids are transparent and hence our model directly applies to them. Even when a liquid is not sufficiently transparent, it can be diluted with water, and the results can be mapped back to undiluted liquid based on dilution level.
- Phone and camera requirements: capillary waves travel quickly. Hence, when taking images of the waves, it is important to choose a fast shutter speed. New phone models have an API for configuring the camera shutter speed and exposure parameters, and hence our choice of evaluating CapCam on an iPhone X. In our experiments, we set the shutter speed so that the exposure time is 1/800 s. Different phone models may come with different cameras and flashlights, and hence require a different choice for the shutter speed. Note that the automatic exposure configuration will not work because the phone tends to choose a longer exposure time, which causes the wave pattern to be fuzzy. One also needs to measure the resolution of the camera and the vibration frequency of the vibro-motor. These measurements just need to be done once for each phone model.
9. Conclusion
In this article, we introduce CapCam, the first mobile application that can measure liquid surface tension. It is based on the relationship between surface tension and capillary waves, and it is convenient and accurate. Our evaluation shows that CapCam has an absolute surface tension error of only 0.75 mN/m, and based on measured surface tension, it can successfully measure alcohol concentration and detect water contamination. Our experiments also show it is capable of accurately tracking the protein level in urine, a key physiological index used in diabetes and kidney disease management. We believe this work can serve as a useful tool and enable new meaningful applications and interactions.
Acknowledgments
We would like to acknowledge Gareth McKinley for providing access to the digital tensiometer used for ground truth measurements of surface tension. We thank Deepak Vasisht, Guo Zhang, and the members of NETMIT for their insightful discussion and comments. We also thank our shepherd and the anonymous reviewers for their valuable feedback.
 This work is licensed under a


Join the Discussion (0)
Become a Member or Sign In to Post a Comment