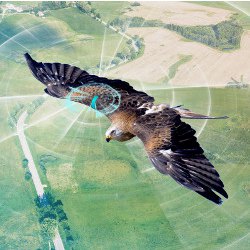
Blogging birds is a novel artificial intelligence program that generates creative texts to communicate telemetric data derived from satellite tags fitted to red kites — a medium-size bird of prey — as part of a species reintroduction program in the U.K. We address the challenge of communicating telemetric sensor data in real time by enriching it with meteorological and cartographic data, codifying ecological knowledge to allow creative interpretation of the behavior of individual birds in respect to such enriched data, and dynamically generating informative and engaging data-driven blogs aimed at the general public.
Key Insights
- Summarizing environmentally enriched satellite-tag data in the form of informative, engaging, and fluent blogs is a challenge, even for trained ecologists, and computer-generated blogs were preferred by readers.
- Natural language generation, specifically data-to-text technology, is sufficiently advanced to achieve more than just factual summarization of data for professional use.
- This development opens new avenues for addressing societal challenges related to communicating data effectively and engaging the public with scientific research.
Geospatial data is ubiquitous in today’s world, with vast quantities of telemetric data collected by GPS receivers on, for example, smartphones and automotive black boxes. Adoption of telemetry has been particularly striking in the ecological realm, where the widespread use of satellite tags has greatly advanced our understanding of the natural world.14,23 Despite its increasing popularity, GPS telemetry involves the important shortcoming that both the handling and the interpretation of often large amounts of location data is time consuming and thus done mostly long after the data has been gathered.10,24 This hampers fruitful use of the data in nature conservation where immediate data analysis and interpretation are needed to take action or communicate to a wider audience.25,26
The widespread availability of GPS data, along with associated difficulties interpreting and communicating it in real time, mirrors the scenario seen with other forms of numeric or structured data. It should be noted that the use of computational methods for data analysis per se is hardly new; much of science depends on statistical analysis and associated visualization tools. However, it is generally understood that such tools are mediated by human operators who take responsibility for identifying patterns in data, as well as communicating them accurately. An important but relatively recent addition to the growing field of data science is a technology called natural language generation15 that automates the entire data pipeline to produce textual reports from data, whether numeric or structured. Originally developed to offer decision support in the workplace, natural language generation has generated textual summaries of technical data for professionals, including engineers, nurses, and oil-rig workers,5,9,13,21 and is increasingly mainstream. Gartner, Inc. forecast in 2017 that 90% of business intelligence systems will incorporate natural language generation by 2019.11 Companies like Arria (https://www.arria.com/), Narrative Science (https://narrativescience.com/), and Automated Insights (http://automatedinsights.com/) have developed software that summarizes data as textual reports; indeed, print-media organizations are increasingly turning to robo-journalism, and many routine data-driven news stories that are time consuming and mundane for professional journalists to write are being written entirely by computer programs. Such data-to-text applications require accuracy and clarity first and foremost, and it has been noted that for workplace applications consistency in language use is the main reason why computer-generated output is preferred to text produced by humans.16
At the other end of the spectrum of computer-generated language is the discipline of computational creativity, whereby computer programs attempt to construct jokes,1 short stories,7 and poetry.8 Here, we use the term “creativity” in the context of “creative writing,” defined by the Oxford Dictionary as “writing, typically fiction, or poetry, which displays imagination or invention (often contrasted with academic or journalistic writing).”a It is frequently said that creativity, especially in relation to design, requires the work to not just be imaginative or inventive but also “appropriate,” as in Sternberg.19 In his account of writing as design, Sharples18 related the idea of appropriateness to “constraints,” which provide the framework and context for creative expression and can be imposed either by the literary genre or by the conceptual space in which the writer is working.
Computer programs for computational creativity use static knowledge sources, typically manually constructed, to source joke templates, narrative plots, story grammars, and characters. In the storytelling domain, creativity manifests itself through emergent narratives dynamically created through the interactions of characters modeled as intelligent agents,20 construction of different narratives from the same underlying plot representation,17 or the tailoring of linguistic components to generate human-like narrative prose.3 Deep neural networks have recently been applied to the generation of poetry by predicting likely word sequences fitting a mood or theme while also modeling tonal and structural constraints imposed by specific genres like Chinese quatrains.28,29
Earlier work exists on communicating spatiotemporal data in the form of stories22 to help children with complex communication needs describe their school day to their parents. Here, microphone and radio frequency identification (RFID) readers were mounted on wheelchairs to make audio recordings by teachers or interactions with RFID-tagged locations, people, and objects. In this work, the computer-generated text was restricted to a factual summary of interactions recorded by RFID, while creativity was incorporated either through voice recordings provided by teachers or through functionality that allowed the children to personalize their stories by editing system output.
The body of work summarized earlier either generates factual reports from real-world data, with creativity introduced through direct human input22 or generates creative texts from formal representation without recourse to real-world data. We are unaware of any previous computer program that generates creative texts from real-world data without human input. Addressing this gap, we describe Blogging Birds, which we designed to generate creative texts from data generated by satellite tags fitted to animals. The focal species for Blogging Birds is the red kite (Milvus milvus). This bird of prey was once widespread in the U.K., but prolonged and intense persecution led to its near extinction by the 1940s.
In 1989, the Royal Society for the Protection of Birds (RSPB) started a scheme to reintroduce the species in various locations across the U.K.4 In one of these locations, the Black Isle near Inverness in the north of Scotland, several birds were equipped with solar-powered satellite tags. Limited human resources meant the tags were used mainly to locate birds that had died to foster detection and prosecution of possible wildlife crimes. However, it was felt there was scope for using data from these tags for public-engagement activities surrounding the reintroduction initiative, to communicate ecological insight that enhances people’s understanding of the species, and to create a positive image of the species to harness public support for the reintroduction.24 RSPB staff were themselves also keen to gain a better understanding of the lives of reintroduced birds, particularly how they recolonized a landscape that held precious few red kites for well over a century. They appreciated the inherent limitations in the data generated by the tags and were open to imaginative interpretations of the data, so long as the behaviors being narrated were ecologically plausible.
These requirements allowed us an opportunity to investigate data-driven generation of creative texts by computers, something we believe Blogging Birds is so far unique in its ability to achieve. The generated texts are creative in that they display imagination and inventiveness in how they interpret and report data under constraints imposed by kite ecology and the data itself. We sought to answer two research questions through experiments: Would the computer-generated blogs be well perceived by readers in comparison to blogs written by humans based on the same data?; and How important would the creative narration of ecological insight be to readers’ perceptions of computer-generated blogs?
The Blogging Birds System
The starting aim of Blogging Birds was to bring satellite-tagged individuals of a species (such as the red kite) “to life” by constructing ecologically sound narratives describing their movements. Conservationists fitted satellite tags—PTT-100 22-gram Solar Argos/GPS PTT—to red kite chicks immediately prior to fledging, using a backpack harness designed for minimal hindrance. The tags were solar-powered and programmed to record up to six location fixes per day. Although this maximum could indeed be achieved during the summer months, a lack of sunlight in Scotland meant fewer fixes (a maximum of four per day) were obtained in spring and autumn and only the occasional fix during winter. To further preserve battery power, data was transmitted from the tag to the satellite only once per week. We thus configured Blogging Birds to produce a blog every week, or each time data was received from a bird.
Figure 1 outlines the overall architecture of the Blogging Birds system. We next describe the main components; see also Ponnamperuma et al.12

Figure 1. System architecture.
Data augmentation. The system processes an email messages with GPS fixes from the tags fixed to the red kites and enriches that data from readily available online sources about the local weather (https://www.metoffice.gov.uk/datapoint), habitat (such as different types of grassland and forests, https://eip.ceh.ac.uk/lcm), and geographic features (such as rivers, lochs, roads, and location names, https://www.ordnancesurvey.co.uk/). Table 1 presents a sample of the enriched data used by Blogging Birds.

Table 1. Example augmented data used for pattern mining for one day of one week for a particular bird.
Data analysis. The system then applies data-analysis procedures for identifying home ranges and patterns of movement with respect to these temporary settlement areas. Home ranges are identified as polygons using the Adehabitat package for R2 by clustering the previous locations of an individual using 90% kernels. As described by van der Wal et al.,24 we modeled local movement patterns as angular and radial velocity vectors to identify excursions, characterized by travel in relatively straight lines at higher speeds. This data analysis allows the document planner (described next) to detect the three prototypical patterns of movement in Figure 2, whereby the kite remains within a home range, explores an area outside its home ranges, or moves from one home range to another. Figure 3 shows the calculated home ranges for a bird (gray polygons), as well as the fixes classified as excursions (black crosses) and non-excursions (amber crosses).

Figure 2. Prototypical red kite movement patterns: C1 is small and constricted movements within an area of intense usage (home range); C2 is exploratory movement from a home range (round trip); and C3 is direct movements between separate home ranges.

Figure 3. Calculated home ranges (gray polygons) and classification of fixes as excursions (black crosses) or non-excursions (amber crosses) for a particular bird.
Document planner. The document planner in Figure 3 identifies patterns in the data that signal different red kite behaviors and creates “messages” (implemented as Java classes) that encode these behaviors for use by the “micro planner” and “sentence realiser,” which then generate sentences in English.
The data analysis allows us to detect the three prototypical patterns of movement outlined in Figure 2, whereby the kite remains within a home range, explores an area outside its home ranges, or moves from one home range to another. An ecological-domain model further defines different travel, foraging, and social behaviors as rules that can apply under specific environmental and geographic conditions; for instance, following heavy rain, a kite observed on any of the grassland habitats might feed on earthworms or a kite observed near a woodland habitat late in the afternoon is likely to be preparing to roost. These rules are implemented as JBoss Drools (http://www.jboss.org/drools), a business-logic-integration platform that allows us to instantiate messages when particular patterns are detected in the data. In total, the system implements Drools for 26 movement behaviors (such as flying along a coast or over a landmark like a castle or loch and the home-range-related movement patterns in Figure 2); 33 foraging behaviors, mostly detailing the food available for a kite in different habitats at different times of the year but also sometimes related to specific features (such as when a red kite near a road might be looking for roadkill); and six social behaviors (such as roosting and nesting); see the online appendix “Example Rules” (dl.acm.org/citation.cfm?doid=3231588&picked=formats).
The pattern-detection module then exhaustively applies the rules to the satellite fixes to produce a list of all observed movement behaviors and all possible foraging and social behaviors consistent with known environmental and geographic conditions. The latter is the first step in the creative process, whereby the program explores the conceptual space to “imagine” how the kite might have been behaving.
Blogging Birds uses a rule-based text planner for dynamic text generation. The planning rules decide how information is ordered, but what information to include and how to organize it into sentences is determined at runtime in a data-driven manner.
The blogs are always planned as three paragraphs, the first describing the overall trends, the second providing more detail on a day-to-day basis, and the third posing a question about what the kite might do next, as well as occasionally offering a conclusion.
The content is selected through a process of summarization and aggregation of information. This is the second creative aspect of the blog generation (the first involved imagining a wide range of possible behaviors), as it plans what story to tell from the imagined behaviors. Blogging Birds aims to provide an overview of the main behaviors and highlight aspects that might be interesting to the human reader. Movement behaviors are considered more interesting than foraging behaviors, and rarer foraging behaviors are prioritized over more frequent ones. Each blog attempts to inform the reader about different aspects of red kite ecology by selecting different behaviors from different days. The main steps are as follows:
Paragraph 1
Movement pattern. Generate a message based on the detected movement pat-tern—C1, C2, or C3 in Figure 2; if the age of the bird can be used to interpret this pattern, add such an interpretation message;
Habitats visited. Generate a message summarizing the habitats visited; and
Other kites. Generate a message about other kites recorded nearby, if any.
Paragraph 2
Days of the week. Iterate over each day of the week (Monday to Friday):
- If the bird remained relatively static—C1 in Figure 2—then generate a message about nearby places or generate a message about any movement behavior detected; and
- Generate a message about a new (not previously used) possible foraging behavior, if any deduced; unusual (historically infrequent) behaviors are selected over common ones.
Remove redundancy. Aggregate the messages generated for the week through these two steps to remove redundancy (such as by grouping together days with similar behaviors).
Paragraph 3
Movement pattern. Generate a message for a question or comment based on the movement pattern—C1, C2 or C3—with the aim of intriguing the reader.
Micro planner and sentence realiser. The micro planner takes the messages generated by the document planner, implements aggregation through a variety of linguistic devices (such as ranges, coordination, and subordination), and limits linguistic repetition by varying the vocabulary. It provides sentence specifications to the “sentence realiser,” which then generates sentences using the SimpleNLG library.6
Figure 4 is a screenshot of the Blogging Birds interface in which an automatically generated weekly blog for a kite is overlaid on a Google map of the bird’s whereabouts with its historical home ranges marked as blue polygons. In this example, Wyvis, one of five red kites being blogged about, has traveled between two home ranges (movement pattern C3), and an explanation for the observed movement pattern is provided based on the age of the bird. The system emphasizes the social side with reference to roosting and encounters with other tagged kites. The second paragraph is narrated chronologically, with care taken again to emphasize any unusual behaviors (such as the long distance flown on Tuesday) and to reference weather conditions (“cloudy”) to make the text more engaging. Information is also provided about the foraging potential of the different habitat types visited. Aggregation is used to avoid repetition, using linguistic devices (such as range “Wednesday to Sunday,” coordination “St Filans, Tullybannocher, and Edinample,” and subordination “mainly on acid grassland, while making odd journeys to arable land”). The question posed in the final paragraph is selected based on the movement pattern detected.

Figure 4. Screenshot of the Blogging Birds Web interface.
Here, we focus on situations where the timeframe covered by each blog is set at one week, as this is the frequency at which the tags are programmed to transmit data. However, the system architecture is sufficiently generic to be able to handle other timeframes, and the interface also allows the user to select a day of the week and read a blog composed for that day. Blogs could in theory also be provided for longer timeframes, but as the goal of the project was to allow readers to monitor or follow the birds on a continuous basis, this option was not implemented.
Evaluation
We investigated both how computer-generated blogs are appraised by readers in comparison to human-written blogs based on the same data and the contribution of the generated ecological insights to such appraisals. To this end, we designed studies to evaluate the quality of the computer-generated blogs for different patterns of movement, first through comparison with blogs written manually, then through comparison with baseline computer-generated blogs that report the data factually without ecological insights.
Method. We focused on the three prototypical movement patterns outlined in Figure 2 as conditions C1, C2, and C3. For each condition, we identified 12 weeks of data such that the focal red kite’s movements broadly matched this condition (for example, the week in Figure 4 would correspond to C3), giving us 36 weeks of data in total.
The generated texts are creative in that they display imagination and inventiveness in how they interpret and report data under constraints imposed by kite ecology and the data itself.
Comparison with human-written blogs. We recruited 12 post-graduate master’s-level ecology students from the University of Aberdeen in Scotland (representative of those who might be hired by a conservation charity) to take part in a two-hour session on “digital media in nature conservation” outside teaching hours. We told them they would be writing three short blogs on the basis of environmental data we would provide, saying it would take them approximately 1.5 hours, that partaking would benefit our research while giving them unique insights into new technologies, and we would compensate them £15 cash to express our gratitude for helping us while learning.
We provided each writer with access to a one-page information sheet about red kites that summarized the typical movement patterns and foraging and social behaviors that were encoded in the Blogging Birds system. They were also free to consult any online sources they preferred. We also provided them with the enriched data available to the system for the week, presented in both tabular form (as in Table 1) and overlaid on a map showing home ranges and fixes (as in Figure 4, but without the blog). The information we provided to the 12 student writers was sufficient to allow them to make the same inferences as the system. However, in order to grant full creative freedom to the writers and avoid priming them to write similar blogs to the system, we avoided giving them direct access to the inferences made or used by the system. They were further informed about the intended purpose of the blogs and the target audience, and each was asked to write three 200-word blogs; that is, for data from three different weeks, one in each condition (C1–C3 in Figure 2) such that for each of the 36 weeks selected for the study we had one manually written blog. The order in which writers encountered each condition was randomized and writers not made explicitly aware of the existence of these conditions in the study, though the patterns were clearly visible on the respective maps and described on the information sheet. These 36 manually written blogs were compared to computer-generated blogs for the same weeks in the evaluation.
As our goal was to investigate Blogging Birds not just as a tool for those with an interest in nature conservation but as a resource to engage those interested in new technologies. We ran evaluations with two distinct groups of participants: 93 undergraduate biology students enrolled in a second year “community ecology” course and 49 first- and second-year undergraduates from across disciplines enrolled in a course entitled “digital society,” both at the University of Aberdeen. In each trial, a participant sitting at an individual workstation was shown an interface with a map with home ranges and fixes of a kite for one of the weeks, as well as two blogs, one written manually and one computer-generated, without any information about their provenance. Participants said what blog they preferred (or expressed no preference) and also rated each blog on how informative, fluent, and engaging they found it on a seven-point Likert scale. Each participant evaluated three pairs of blogs. We designed the study to test three specific hypotheses:
H1. Computer-generated blogs are preferred to human-written blogs;
H2. Computer-generated blogs are more informative, fluent, and engaging than human-written blogs; and
H3. The differences in ratings for computer-generated and human-written blogs are conditional on the movement pattern of an individual bird C1, C2, or C3, as in Figure 2.
Comparison with baseline. To directly evaluate whether communicating ecological insights through the blogs is important to readers, we compared Blogging Birds to a computer-generated baseline that blogs about the movement patterns without reference to ecological concepts; see Table 2 for an example. These baseline blogs were entirely factual and reported behaviors only directly observed in the data but that otherwise followed the same format as the full-system blogs. An additional 27 undergraduate students enrolled in the digital society course, but who had not participated in the earlier experiment, evaluated the full vs. the baseline system using the same methodology and interface as before. We designed this study to test two specific hypotheses:

Table 2. Baseline computer-generated blog without reference to ecological concepts for the week outlined in Figure 4.
H4. Computer-generated blogs with ecological insights are preferred to baseline computer-generated blogs without ecological insights; and
H5. Computer-generated blogs with ecological insights are more informative and engaging than baseline computer-generated blogs without ecological insights, while their fluency is comparable.
Results
Evaluation against human-written blogs. Both sets of students showed an overall significant preference for the computer-generated blogs (238 trials vs. 153 trials in which human-written blogs were preferred; Χ2 = 18.5; p < 0.001), confirming hypothesis H1. However, a more complex pattern emerged (see Figure 5), with this preference being dependent on the type of kite movement covered in the blog—C1, C2, or C3—and the orientation of the course—ecology or technology.

Figure 5. Preferences for human-written and for computer-generated blogs by movement condition, as in Figure 2: C1 is movement within a home range; C2 is a round trip; and C3 is movement between home ranges.
Across the community ecology students, there was a strong preference for computer-generated blogs when they captured more extensive movement by the kites—round trips (C2) and movement between home ranges (C3)—while there was little difference in preference between the two blog types when kite movement was limited; that is, small movements within home ranges (C1). Digital society students showed an overall clear preference for the computer-generated blogs only when they described round trips (C2). Combined, our findings indicate Blogging Birds is particularly skilled at handling cases where the focal bird shows substantial movement. Average ratings for how fluent, engaging, and informative the blogs were (see Figure 6) showed the main perceived advantage of the computer-generated blogs pertains to their “informativeness,” with smaller improvements visible for how engaging and fluent they were.

Figure 6. Average ratings for human-written and for computer-generated blogs by movement condition, as in Figure 2: C1 is movement within a home range; C2 is a round trip; and C3 is movement between home ranges.
We ran a MANOVA, with informativeness, engagingness, and fluency as the dependent variables and blog type (computer or human), kite movement-pattern (C1, C2, or C3), student group (community ecology or digital society), and their interactions as fixed effects, and writer ID and evaluator ID as random effects. We found the following main effects and interactions at p<0.01: computer-written blogs were rated significantly higher (p<0.0001) than human-written blogs (confirming hypothesis H2); students in the digital society course gave higher ratings overall than students in community ecology (p<0.01); and there was interaction between blog type and movement pattern (p<0.0001), confirming hypothesis H3. Post-hoc analysis using the Tukey HSD test on the individual ANOVAs with Bonferroni-correction revealed this interaction came about because the computer-generated blogs capturing conditions with more movement by kites (C2 and C3) were more informative than the human-written blogs for the same conditions and more informative than computer-generated blogs capturing constricted movement (C1) (p<0.0001 for each comparison).
To better understand these described effects, we compared the distribution of ratings obtained by each human writer (H1–H12) and the computer (Comp) in Figure 7. Only two of the blog writers (H3 and H10) were deemed to write more informative blogs than the computer, and both of them were considered less engaging and fluent than the computer-generated blogs. Likewise, H4, who wrote more fluent and engaging blogs than the computer, was rated rather low for “informativeness,” thus illustrating the difficulty of being informative, engaging, and fluent at the same time, even for a human writer. Indeed, all the writers were committed and used the full 1.5 hours for composing the blogs, yet most were outperformed by the computer on each of the three metrics. For examples of human-written and computer-generated blogs, as well as details of how they were appraised by evaluators, see the online appendix.

Figure 7. Computer-generated blogs (Comp) vs. human-written blogs (H1–H12).
A questionnaire filled out by the blog writers provided many interesting insights. In general, they found it difficult to comprehend and summarize the sheer amount of data in fewer than 200 words but also felt the process became easier the more they did. There was, however, concern from many that the blogs were becoming repetitive, especially if there was little variation in what the red kites were actually doing, stemming largely from a lack of knowledge of kite ecology and behavior. Summarizing the range of data in different formats was certainly challenging, and some enjoyed the process more than others. There was considerable variability in how the blog writers used the materials provided them to create the blogs. Some concentrated mostly on the visible patterns on Google maps, others looked in more detail at the map data by clicking on individual map points to find out more, and yet others found inspecting the data in a tabular format was most useful. Asked whether they would like to write the red kite blogs as a job, the consensus was that, although initially enjoyable, it would quickly get tedious and increasingly more difficult to write non-repetitive material.
Telemetric data is ubiquitous, captured by smartphones and other mobile devices, as well as through GPS sensors embedded in vehicles used by the transportation industry and others.
Evaluation against baseline. Participants demonstrated a conclusive preference for the full system with ecological insights, preferring it in 61 trials compared to only 20 trials in which the baseline was preferred (Χ2 = 21.5; p < 0.001), confirming hypothesis H4. Interestingly, this effect was strongest when blogs described situations with little movement by the birds during those weeks (C1); here, the full-system blogs were preferred in 23 trials compared to just four baseline blogs (Χ2 = 13.4; p=0.0002). For C2 and C3, the corresponding values were preferences for the full system in 20 and 18 trials, compared to preferences for the baseline in eight trials each (Χ2 = 5.1, 3.8; p = 0.0233, 0.0499). The absence of ecological interpretation by the baseline system was thus judged adversely for all movement patterns, particularly so when the birds were relatively static. We also found the full blogs were rated as more informative (p<0.0001) and more engaging (p=0.0215) but not more fluent (p=0.825) (see Figure 8), confirming hypothesis H5.

Figure 8. Computer-generated blogs with ecological insights (full system) vs. computer-generated blogs describing movement patterns only (baseline system).
The two studies we have presented here demonstrate that computer-generated blogs are appraised more positively than human-written blogs, and that computer-generated blogs with creatively generated ecological insights are preferred overwhelmingly to blogs generated from the same data but without inclusion of these insights.
Conclusion
The Blogging Birds system shows that raw satellite tag data can be transformed into fluent, engaging, and informative texts directed at members of the public and in support of nature conservation.
We demonstrated that computers can compete with human experts in generating creative stories from numerical data. Unlike natural language generation systems that generate texts for news reporting or for decision making in the workplace, Blogging Birds’s narratives are not entirely factual. Though the system is constrained by the observed data and its ecological domain model, the red kites’ reported foraging and social behaviors are only imagined to have taken place. However, including these behaviors in the narratives allows us to communicate red kite ecology to the reader, and the blogs are better appraised as a consequence. Our work thus simultaneously addresses the societal challenges of communicating data effectively and engaging the general public with scientific research.
Blogging Birds composes blogs by combining texts produced through three different types of analysis: The first is a generic factual summarization of telemetric data enriched with location-specific information about weather conditions, habitat type, and geographic features, and can be readily adapted for use in other domains. The second is the processing and ecological interpretation of movement data in the context of home range use, and the third is the exploitation of domain knowledge encoded as a collection of rules that help the system imagine possible foraging and social behaviors from environmental and geographic parameters. Much of what is creative and interesting about the blogs derives from the latter domain-specific types of data analyses. Although the developed principles apply more broadly, new applications would require construction of knowledgebases pertinent to the domain of use. While this is a clear limitation of our approach, note our ecological interpretation of movement data in particular would be applicable to several other species. For example, we have already developed a version of Blogging Birds for golden eagles (Aquila chrysaetos) for use by RSPB conservation officers, successfully reusing the second, as well as the first, type of analysis.
During the course of the project, we also discovered ecologists had limited knowledge of the foraging behavior of red kites in Scotland, as they had not been studied extensively following their relatively recent reintroduction. We could thus encode only a limited number of rules per habitat type. The absence of any large-scale corpus of texts in this domain also meant we could not apply the deep learning methods that are rapidly gaining popularity for generating linguistic variation in computer-generated texts.27 In future work, we plan to invite Blogging Birds’ users to contribute behavioral observations from across the U.K., enabling us to simultaneously curate a larger set of rules and further public engagement.
Finally, our ideas demonstrated here are applicable more generally. Telemetric data is ubiquitous, captured by smartphones and other mobile devices, as well as through GPS sensors embedded in vehicles used by the transportation industry and others. Even albums of time-stamped and geo-tagged photos provide data similar to what we used here. The nature of the blogs, along with the information sources used for data enrichment, would depend on the application, to blog about a holiday or reveal the provenance and journey of a food item in a supermarket. In effect, we have demonstrated it is possible to blog about such data through a process of data enrichment and natural language generation, opening up new avenues for using AI to engage people through data.
Acknowledgments
This research was supported by an award from the RCUK Digital Economy Programme to the dot.rural Digital Economy Hub, award reference EP/G066051/1.


Join the Discussion (0)
Become a Member or Sign In to Post a Comment