
Conceptually, dynamic analysis is simply the movie of the execution of a computer program. Sounds easy? It’s not.
Today, something as simple as a Google query involves dozens of network requests and millions of objects in memory … only in your browser. How to understand the machinery behind a single Google query? Today, this is easy. An off-the-shelf browser such as Chrome embeds its own dynamic analyzer,5 which is easy to use and beautiful.
In this post, we use the debugger of Google Chrome to present a runtime autopsy of a Google query. The scenario is straight forward: you open the browser, you type a query on Google, and you click the search button. What happens behind?
Network requests
Let’s start with a first dynamic analysis: we log and observe the network requests. After only typing “http://www.google.com [Enter],” there are 23 HTTP requests sent to the Google servers:,
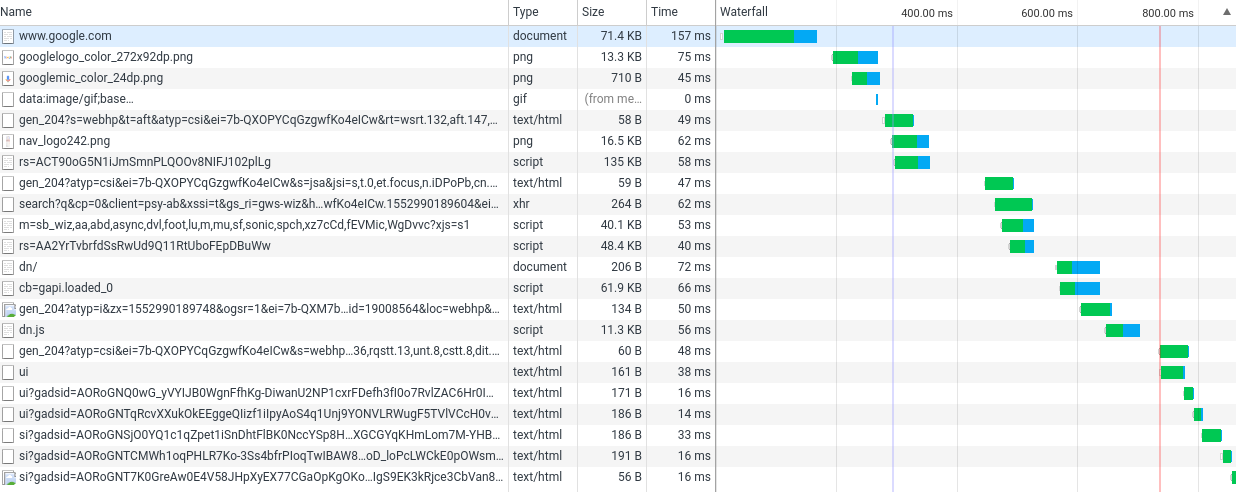
The first request is the main one; it fetches a typical page of 71.7KB mixing HTML and Javascript code, which are the two main programming language of today’s Web. This initial page triggers all the subsequent requests. Four of them load images (png, gif), including the Google logo, while the rest loads code (mostly Javascript code). Many requests simply touch base with Google and fetch nothing (all the requests with 100-300 bytes, which means only HTTP headers), but probably trigger some tracking or advertisement’s code on Google’s server. On the righthand side of the screenshot, one sees that some requests are made in parallel (for instance, the 5th, 6th and 7th ones).
Monster DOM
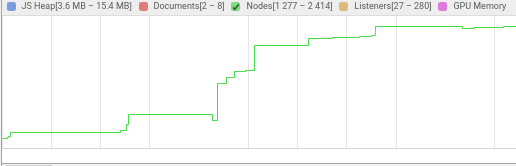
Next, the browser builds the visual representation of the Google home page. All visual objects that need to be displayed are organized in the “Document Object Model,” a.k.a the “DOM.” The DOM contains all buttons, images, pages, and subpages, text fields that the browser must display to the user. When the browser interprets the information included in the DOM, it knows exactly what to draw on the screen to build the page. Now, when we type our actual query “extraordinary software [Enter]” in the iconic Google search field hundreds of DOM elements are loaded in the browser. All these elements included all the suggestions computed by the ‘Google instant’ feature every time we press a key on our keyboard. Chrome’s analyzer records this progressive loading of DOM nodes (up to 2414 nodes) and also one screenshot per change.
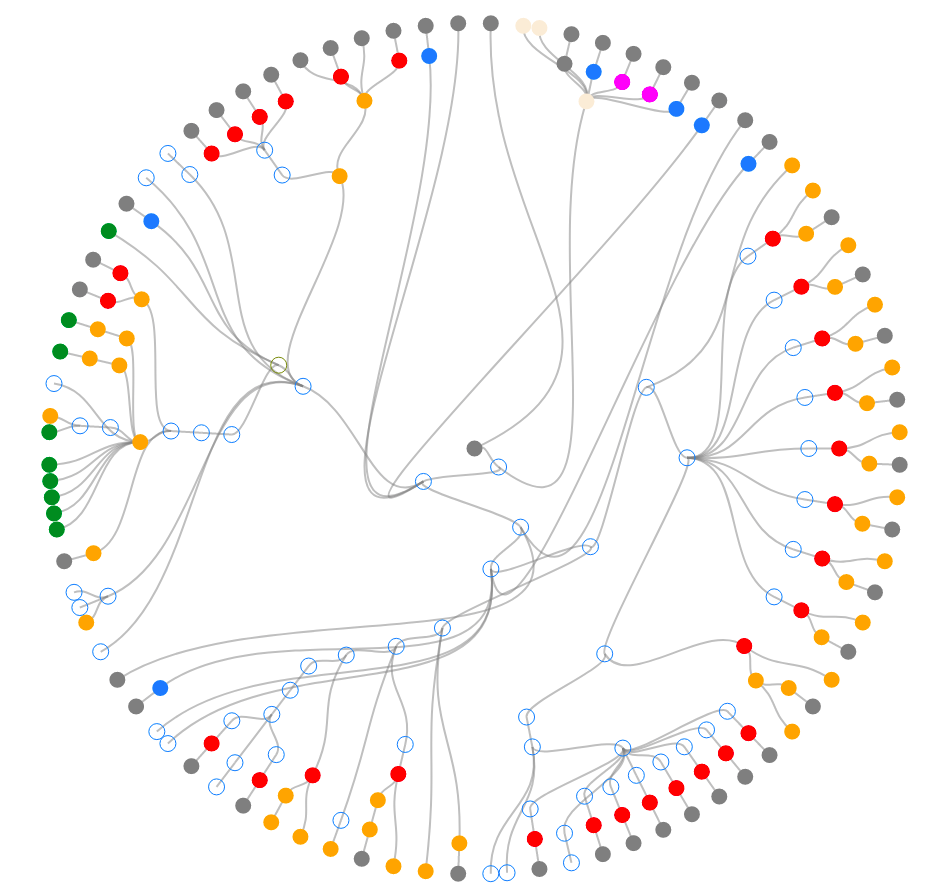
This DOM tree can be represented with a visualization inspired by the Web Stalker6 (representation not from Chrome’s analyzer)

Function calls as Flame graph
Now we focus on the execution of Javascript code. By querying the web on google.com, several events happen in the browser: from a slight mouse move to a keystroke. Each of these events triggers a complex computation that is decomposed into calling multiple functions. This means that a single action is actually handled by long sequences of operations that trigger each other in a recursive way: one function that handles a keystroke calls another function that calls another function and so on, up until tens of calls.
Function call trees are well represented with `flame graphs’.7 Below, we show a flame graph for the function calls that run in the browser when hitting one single key while entering a query. The big yellow bar at the top is the top level event loop in the browser that handles the keystroke. A single keystroke triggers the execution of nine other operations, displayed on the screenshot as yellow and purple boxes on the second line. These nine operations trigger other operations themselves during their execution, shown in the level below, and so on. This goes as deep as 109 stacked operations triggered to handle a single keystroke. Most of these operations actually handle the ‘Google Instant’ feature that automatically shows a list of topics related to the words that have just been written so far.1

The Browser is only the First Stage of the Rocket
We have dissected the inner behavior of a Google query in the browser. This is actually a very small part of the much larger sequence of software executions involved in a Google query. In addition to the code executed by the browser, there are many other computations;
- The code executed in the host operating system to orchestrate the blazing-fast conversation between the browser, the mouse, the display, the keyboard, and the network drivers.8
- The code executed in all the routers, firewalls, and network appliances between the browser and Google’s machines.
- The code executed inside the data centers, on multiple servers queried in parallel for the selection of relevant web pages, the ordering of these pages, the optimization of advertisement, the tracking of user actions and history.3
This represents massive amounts of code, that we would love to visualize also. However, this cannot be monitored and visualized with the browser debugger; only Google engineers can monitor the execution of their servers.
Do it Yourself
This dissection is easy to do on your own! There are many other visualizations to explore!
Do it yourself:
-
Open a Chrome browser.
-
Type Ctrl-E (or “Menu” >> “More Tools” >> “Developer Tools” >> “Performance” tab, “Click the record button”)
-
Go to your favorite Web application.
-
Do something.
-
Stop recording.
-
Explore the many tabs and visualizations, try to understand what happens.
Conclusion
With this guided tour in a trivial and daily digital action—a Google query—we wanted to reveal the extraordinary complexity of today’s software. We refer the readers intrigued by this extraordinary complexity to technical papers, such as 4. The visualization of the computation behind a Google query can even become art: Joana Chicau, a digital choreographer, is known for altering, in real time, the execution flow of a Google query.2
REFERENCES
1Google Instant with Bob Dylan, September 8, 2010: https://youtu.be/qcm0rG8EKXI
2Chicau, W., A Web Page in Three Acts: https://berlin-ak.ftp.media.ccc.de/congress/2018/h264-hd/35c3-9598-eng-A_WebPage_in_Three_Acts.mp4
3How Search Works, Google, March 4, 2010: https://youtu.be/BNHR6IQJGZs
4Rahman, M.T., Rigby, P.C., and Shihab, E., The Modular and Feature Toggle Architectures of Google Chrome, Empirical Software Engineering, April 2019, Volume 24, Issue 2, pp 826–853 http://users.encs.concordia.ca/~pcr/paper/Rahman2018EMSE-preproduction.pdf
5Chrome DevTools, Google, https://developers.google.com/web/tools/chrome-devtools/
6The Web Stalker, V2_, Lab for the Unstable Media, https://v2.nl/archive/works/the-web-stalker
7Flame Graphs, http://www.brendangregg.com/flamegraphs.html
8How Browsers Work: Behind the Scenes of Modern Web Browsers, https://www.html5rocks.com/en/tutorials/internals/howbrowserswork/
Benoit Baudry is professor at KTH Royal Institute of Technology, and director of the CASTOR Software Research Center. Martin Monperrus is professor at KTH Royal Institute of Technology, where he holds a Chair from the Wallenberg Autonomous Systems and Software Program.


Join the Discussion (0)
Become a Member or Sign In to Post a Comment