Bülent Yener discusses "Cell-Graphs: Image-Driven Modeling of Structure-Function Relationship" (cacm.acm.org/magazines/2017/1/211111), a Review Article in the January 2017 CACM.
---
TRANSCRIPT
00:00 Before joining the faculty at Rensselaer Polytechnic Institute in upstate New York, Bülent Yener was a Member of the Technical Staff at Bell Labs. In 1999, he helped create a map of the Internet. At RPI he wanted to apply that experience to a new problem.
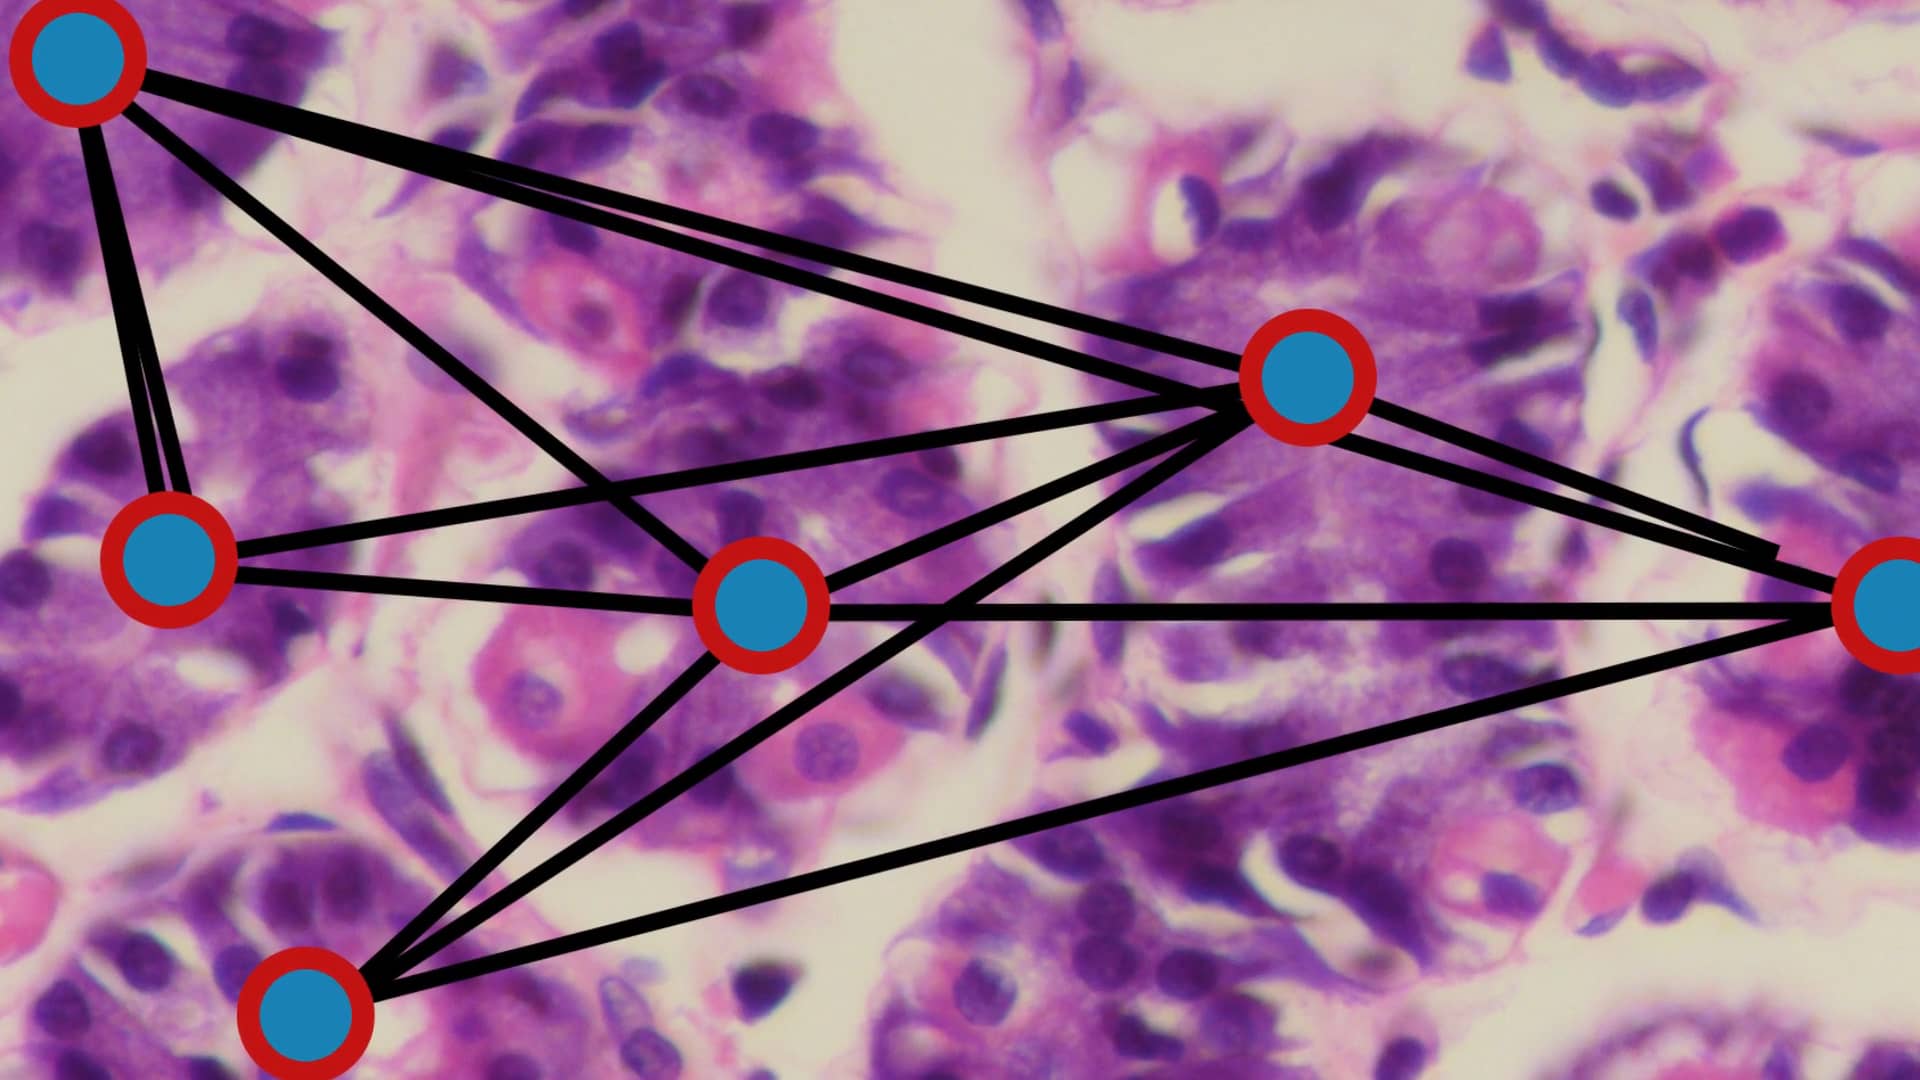
00:20 DR. YENER: And I asked myself: What would grow like the Internet, in a selfish, decentralized way, in a chaotic way. I don't know why, but it came to my mind that maybe the cancer tumor has some similar behavior. ... And I said, well, can I build the map of a tumor, can I build the graph of a tumor? And can I show that that graph is different than a tissue without a tumor in it? And that's how it started.
00:55 [Intro graphics/music]
01:05 When Dr. Yener created his graphs of cancer tumors, he looked at their cellular microstructures for clues about their functions, much as close examination of tree bark tells you whether you're looking at a redwood, or a sycamore, or an elm.
01:22 He believed that this approach could go beyond the analysis of tumors to help diagnose and cure all kinds of disease, and to help improve artificial implants. He took the approach used by system biologists and turned it on its head.
01:37 DR. YENER: The approach has been reductionist. They basically dissect the system into small pieces, and then they try to put it together. Our approach is a little bit different. We are coming from more computational and more synthesizing way than reductionists' approach.
02:00 It all starts with stained tissue samples, further enhanced with image processing.
02:06 DR. YENER: We use many techniques. We use threshholding, clustering, watershed, region growing -- these are all different image-processing algorithms that we deploy to extract the nodes of the graph that we are going to build, which are actually cells or sometimes small cluster of the cells.
02:26 A pathologist can typically only see five or ten patterns. But cell graphs notice invisible features.
02:33 DR. YENER: When we take the problem from the dish and when we process it with computers. And then when we make the abstraction by using graph theory to represent that tissue, all of the sudden now we have up to 128 different patterns or features that we are looking for.
02:59 With artificial intelligence discovering even more patterns, new applications may emerge.
03:05 DR. YENER: Suppose now we take it into a chip. And it's a part of your smart watch, or it is a chip that is in a hat, that keeps on talking to some sensors, measuring the EEG signals, and running the AI in the background to see if you are coming close to some seizure. And if you are coming close to a seizure, maybe it gives you an alert. ... I think it will happen in the future. It will be a part of us.
03:39 Get all the details in this month's Communications of the ACM, in the review article, "Cell-Graphs: Image-Driven Modeling of Structure-Function Relationship".
03:49 [Outro and credits]