Frequent blood pressure monitoring is the key to diagnosis and treatments of many severe diseases. However, the conventional ambulatory methods require patients to carry a blood pressure (BP) monitoring device for 24 h and conduct the measurement every 10–15 min. Despite their extensive usage, wearing the wrist/arm-based BP monitoring device for a long time has a significant impact on users’ daily activities. To address the problem, we developed eBP to measure blood pressure (BP) from inside user’s ear aiming to minimize the measurement’s impact on users’ normal activities although maximizing its comfort level.
The key novelty of eBP includes (1) a light-based inflatable pulse sensor which goes inside the ear, (2) a digital air pump with a fine controller, and (3) BP estimation algorithms that eliminate the need of blocking the blood flow inside the ear.
Through the comparative study of 35 subjects, eBP can achieve the average error of 1.8 mmHg for systolic (high-pressure value) and -3.1 mmHg for diastolic (low-pressure value) with the standard deviation error of 7.2 mmHg and 7.9 mmHg, respectively. These results satisfy the FDA’s AAMI standard, which requires a mean error of less than 5 mmHg and a standard deviation of less than 8 mmHg.
1. Introduction
BP provides doctors with insight to initiate their diagnosis. For example, chronic kidney disease, sleep apnea, and adrenal and thyroid disorders can all cause high BP, whereas low BP indicates the possibility of heart or endocrine problems, dehydration, severe infection, or even blood loss. Additionally, uncontrolled elevated BP is a major symptom of many life-threatening diseases, such as hypertension, heart failure or stroke.4 Commonly, the reliable approach to measure BP was done by a health care practitioner using inflatable wrist cuff with a pressure gauge. Since the invention of digital BP devices, nonmedical trained users can self-measure their BP at home, as an acoustic sensor can replace the stethoscope, and a pressure sensor with a DC pump can substitute the pressure gauge and hand pump. However, these devices often cause discomfort and inconvenience for those who need frequent BP monitoring, such as hemodialysis (kidney failure) patients,18 individuals with undiagnosed white coat hypertension or undiagnosed masked hypertension. There is also an increased use of frequent BP monitoring for postoperative organ transplant recipients. In such cases, BP is measured every 30 min for 24 h,9 although each hemodialysis session takes around 4 h. Therefore, there is a significant need for an unobtrusive and comfortable BP monitoring approach. In the case of prolonged dialysis, patients hardly rest because the BP cuff constantly squeezes their arm and often hinders the wearer’s mobility. Therefore, by moving the location of measuring BP to inside the ear, our device has a minimal impact in affecting the users’ mobility and comfort.
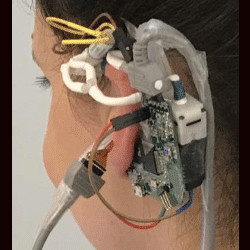
In this paper, we aim to develop a novel wearable system to capture BP inside the ear called eBP, as illustrated in Figure 1. eBP resolves the aforementioned issues with its discreet design, quiet components, and convenient location.

eBP includes (1) a light-based pulse sensor attached to an in-ear inflatable pipe (or balloon), (2) an air pump, a pressure sensor, and a valve controlling module to control the balloon’s contact to the in-ear skin for pulse measurement, and (3) a BP estimation algorithm. The in-ear pipe is slowly inflated by the digital pump to create small pressure on the outer ear canal until the diastolic and the systolic values are estimated.
Challenges: Realizing eBP has the following challenges:
- In-ear BP monitoring is an unexplored topic in which many of the existing techniques cannot be applied. Even the feasibility of the technique has not been confirmed.
- The mechanism enabling the use of an inflatable balloon to measure BP from inside the ear is nontrivial. When the balloon inflates, the sensor should attach firmly to the ear canal and not slide out. In addition, applying insufficient pressure will result in an inaccurate BP measurement, although applying too much pressure may cause discomfort or hurt the ear canal.
- The in-ear pulse signals are weak and buried under noises. In addition, the motion artifacts are difficult to remove and can impact BP measurement accuracy.
- BP measurements are sensitive to the contact quality (i.e., pressure) between sensor and in-ear skin; yet maintaining consistent contact pressure is difficult.
Contributions: In this paper, we make the following contributions. First, we propose a novel concept of in-ear frequent BP monitoring. Second, we propose a blocking-free optical-oscillometric approach to allow the in-ear sensor to measure important parameters in BP measurements (i.e., systolic amplitude and diastolic amplitude). Third, we prototype a device with a custom-built circuit and hardware/software components for in-ear BP measurements. The light-based inflatable pulse sensor is built using an off-the-shelf catheter attached with a plethysmography (PPG) sensor.
2. Fundamentals of BP Measurement
The section begins with a brief study of existing BP monitoring widely used nowadays. We will then point out its current limitations, setting a stage for our novel approach. Although invasive BP monitoring approach promises highly accurate results, it is costly and only available in clinics. Noninvasive techniques are far more favorable as their process is quick, low cost, and relatively simple. The noninvasive BP measurement relies on a technique called oscillatory.
Noninvasive BP requires an inflatable cuff squeezing around the arm or wrist to generate blood flow signatures. Based on these signatures captured by the pressure gauge, HCP can estimate the BP values. In particular, when the cuff pressure is equal to the systolic pressure (SBP), blood flow continues through the occluded artery, but only the highest arterial pressure can be detected. On the other hand, if the cuff pressure is lower than the diastolic pressure (DBP), the detected pulse is very weak. Oscillatory method was developed for the digital device to estimate BP from the change of pulse amplitude. It detects the maximum pulse amplitude (MAP) AM first and applies predefined fractions of the peak amplitude ratio AM/AS and AM/AD to detect where the systolic and diastolic pressure occur and use these values to infer the pressure. AS and AD are the amplitude of systole and diastole, respectively. Unlike auscultatory methods, oscillatory methods do not need to completely occlude the blood vessel in order to detect the systolic BP,10 which is well-suited for our balloon model. However, current oscillation ratios are only applicable for the arm or wrist BP measurement model. Therefore, they are not eligible for our in-ear case. Generating a new in-ear ratio requires a large-scale dataset, such as an invasive method to measure BP from inside the ear, which is infeasible. Instead, we propose a technique to measure BP without applying the characteristic ratios. To achieve this goal, we thoroughly examine the change of amplitude with respect to the change of cuff pressure. Then, we extract the key properties and formulate them into mathematical equations for processing. According to Guest commentary,3 during the deflation:
- Pulse amplitude increases when the cuff pressure is close to the systolic level. The increment increases more quickly when the pressure reaches and passes through the systolic point.
- At the systolic and diastolic cycle cross section, the amplitude obtains its highest value (the MAP).
- Amplitude rapidly decreases once the pressure passes the MAP and moderately decreases once it reaches the diastole point. In other words, the DBP position occurs at the highest decreasing amplitude.
These observations provide key insights for composing the solutions to detect MAP, SBP, and DBP. In particular, the diastolic position is the minimum of the downslope amplitude, and MAP is the peak of the amplitude. We can derive the systolic location as being the maximum of the upslope amplitude. However, sometimes our in-ear balloon pressure might not reach the systolic phase due to comfort requirements. Therefore, we have to rely on the relational equation between MAP, SBP, and DBP7:

where β is the systole ratio of the cardiac cycle and PM, PS, and PD are the MAP, SBP, and DBP, respectively. Most literature reports β as a fixed value14, 16 and is widely accepted, but each person can have a slightly different ratio dependent on age, gender, and health condition. Moreover, an incorrect estimation of β increases the estimation error, as noticed from Drawz et al.19 In our eBP system, we propose an adaptive estimation for β based on the pulse-wave form.
3. System Overview
We designed our system as shown in Figure 2 to address the aforementioned challenges.

Nonratio approach for the calculation of systolic and diastolic BP. Unlike the oscillometric method, we do not apply the fixed-ratio BP because there is no valid ratio for inside the ear. For safety purposes, our pressure may not cover the SBP range. Therefore, we aim at estimating the pressure in diastole first according to its minimal downslope amplitude. Then, we substitute the DBP into the MAP-relational equation to estimate the SBP. Moreover, we propose a personalized approach to estimate the systolic fraction β instead of using the common fixed ratio.
In-ear pulse sensor with the flexible circuit. eBP uses the light-based sensing technique, named photoplethysmography (PPG),23 to capture the superficial pulse (BP value). The optical sensor is small and sustainable enough to be attached to the balloon. However, the state-of-the-art BP sensing technology is often designed on a printed hard circuit board. When the sensor is placed on the balloon, its surface might create sharp contact, which may hurt the user’s ear. We overcome this problem by designing a flexible BP sensing circuit. This flexible circuit adapts to the balloon’s deformation, making the device comfortable to use for a long period of time (Figure 3).

Figure 3. In-ear BP module design.
High-quality elastic balloon. The balloon, which serves our specific purpose, needs to satisfy the following criteria: biocompatibility, safety, high elasticity, consistency, and be strong and resilient to. To satisfy these conditions, we customize an off-the-shelf medical balloon often used for bladder catheterization.
In-ear PPG signal qualification. The in-ear PPG power is weaker than that of the finger, wrist, or arm. Therefore, after basic preprocessing, we employ two techniques for signal qualification, such as the Peak Interval Variation and Entropy Variance, to eliminate bad data chunks and identify the correct position inside the ear to place the sensor. For conventional signal filtering, we process every 50 ms with DC removal and a bandpass filter. This procedure helps to get rid of noise and other unwanted band signals, to disclose only the pulse waveform. With data that qualifies for this criteria, we calculate their amplitude using our modified peak-to-peak technique.
In-ear PPG signal processing. (1) Modified peak-to-peak amplitude calculation: Current peak-to-peak calculation is inconsistent for real-time processing due to the random order of peaks and bottoms. We propose a solution by adding a verification module to ensure the order consistency. (2) Drift removal for Mean Arterial Pressure detection: During the first few seconds of the balloon deflating, a large drift away from the calibrated pressure causes the false detection of maximum amplitude. We have developed a solution to detect the MAP based on its local maxima property regardless of the appearance of the drift.
Ear-worn air pump and draining components. Air pump and draining components are designed to inflate and shrink the balloon with predefined configuration. We target the miniaturized components to develop the air pump. The controller will process the signal and detect whether the pressure is sufficient. Then, following the information, it will decide if more air should be pumped in or if the valve should be opened to reduce pressure. The final product will be worn outside the ear.
4. System Hardware Design
Proprietary design of the balloon attaching PPG sensor. The inflatable in-ear pulse sensor is designed by integrating a PPG sensor with the balloon of a Foley catheter made by POIESIS MEDICAL,6 as illustrated in Figure 4. The Foley catheter is 100% medical silicon so it can be safely and comfortably inserted inside the body.6 We found that SFH7050 PPG sensor from OSRAM1 is the best fit for the small size of the ear canal. The sensor needs to be highly sensitive to capture the weak pulse signals from inside the ear and small enough to place into the ear canal. In particular, it has the size of 4.7 mm X 2.5 mm X 0.9 mm and performs highly accurate measurements due to its special design for the crosstalk blocking technique.1

Figure 4. In-ear PPG sensor and balloon design.
The catheter balloon usually expands in all directions, easily breaking the connection between the balloon surface and the PPG sensor. Therefore, we improvise the balloon structure by hardening one side and only allowing it to expand on the other side. The PPG sensor is soldered on a thin layer (0.1 mm) of flexible PCB and then is integrated on the hardened side of the balloon catheter by using a thin layer of liquid silicone gel. After curing for 1 h at 80°C, the bonding between the PPG sensor and catheter surface becomes hardened and stays robust. Furthermore, to make the sensing unit more comfortable inside the ear, we coated Smooth-On Ecoflex 00-30 soft silicone2 around the edge of the sensor, covering all sharp corners. The surface of the sensor was kept at by using a glass slide, which is removed once the Ecoflex is cured. Thus, the surface of the sensor offers a better sensing ability.
In-ear balloon pressure monitoring. The relationship among pressure inside the balloon, its volume, and diameter has been shown by experiments in literature to be nonlinear.17 Especially when the diameter is in the range from 7 to 9 mm inside the ear canal, the pressure has an initial peak called the equilibrium point accompanied by a slow balloon expansion as the constituent polymer makeup of the balloon is altered. After the balloon has reached its equilibrium point, the pressure inside the balloon will keep stable or reduce, even if its volume increases. As a result, we cannot rely on pressure values to know whether the balloon has reached the wall of the ear canal or not. Instead, the quality of PPG signals is observed and the pump will be stopped when we observe clear PPG signals.
In addition, an over-threshold protection mechanism is implemented to stop pumping air when the pressure inside the balloon is over the threshold. As the size of each person’s ear canal is different, with its diameters in the range from 2.4 to 17.5 mm, we want to continuously and slowly inject the air until one side of the balloon touches the skin of the user’s ear canal and partially blocks the artery. However, the balloon also has its limit as to how much air it can hold. Thus, we do not want to inject too much air into it, making it permanently deformed or causing it to burst. From the balloon’s specifications6 and an experimental burst test from Mathis et al.,17 the failure pressure of the silicone-based balloon is between 15 and 20 psi. Thus, the pressure inside the balloon is continuously monitored by the MCU and the pump will be stopped if the pressure reaches more than 10 psi, as a rule of thumb. This addresses the challenge of different ear canal sizes although maintaining the safety of our system.
Central processing controller. The central controller as shown in Figure 5 is responsible for (1) communicating to mobile devices through Bluetooth to receive commands and report sensing data, (2) driving the analog front-end IC to collect the PPG measurement to the sensor, and (3) controlling the pump/valves to control the balloon pressure for accurate PPG measurement. Overall, Figure 6 presents the eBP prototype depicting the integration of the in-ear pulse sensor with the main module.

Figure 5. eBP hardware.

Figure 6. eBP prototype.
Power consumption. Low power consumption is an important requirement of a wearable device because it directly affects the user’s mobility and comfort, which are the advantages over the conventional cuff-based BP measuring devices. Thus, all components in our designed prototype are chosen to operate with low-power consumption and also have small sizes. During a BP measurement, the MCU, AFE, pressure sensor, and Bluetooth module consume at maximum of only 4.6 mA, 325 uA, 1.7 mA, and 30 mA, respectively. The LED transmitter, valve, and mini pump draw 10 mA, 110 mA, and 150 mA, respectively. Thus, our module consumes around 303 mA although the BP measurement is running. On the other hand, only 4.95 mA is drawn when our measurement is not running. Thus, a 400 mA Li-Po battery could provide up to 1.3 h of continuous measurement (i.e., 80 measurements). However, running the device all the time is not practical or necessary. Instead, the users usually only need to measure their BP a few times per day. If the system is not running any measurement, it can last for more than 2 days (53 h) in an idle state.
5. In-Ear Blood Pressure Estimation Algorithms
We propose our algorithm to handle blocking the artery inside the ear, which only blocks part of the artery and does not depend on the fixed BP ratio. In particular, eBP determines the MAP and DBP first from direct measurements and then infers SBP indirectly (Figure 7).15

Figure 7. Amplitude vs. pressure.
We apply Equation 1 to estimate the SBP (PS), given the pressure of MAP (PM) and diastole (PD). In addition, we propose an adaptive estimation for β which is the systole ratio of the cardiac cycle. We also notice that the derivation of Equation 1 will lead to the adaptive estimation of β. Therefore, we first present the mathematical model of obtaining the Equation 1 and then introduce our proposed formula to calculate β. We formulate MAP in one pulse cycle as follows:
 in discrete form or
 in continuous form. By assuming systole belongs to the interval (0, τβ) and diastole is from (τβ, τ), PM is the total pressure average of systolic and diastolic pressure:
 . Then, we multiply the first term and second term by β and 1 – β, respectively.

 is the average of SBP and
 is the average of DBP. Note that Equation 1 is equivalent to Equation 2 by substituting
 and
and
 . In one cycle, we detect the peak and two bottom points, and then subtract their position in sequence as shown in Figure 8. ΔtD, ΔtS, and tC are the duration of diastolic, systolic, and the whole cycle, respectively. The systolic fraction is β = ΔtS/ΔtC. Given a frame of n cycles, we can compute β by averaging all βi in the frame. As our system runs in real time, we only collect the first 10 cleanest frames to estimate the systolic fraction.

Figure 8. Systolic fraction β detection.
 5.2. Mean arterial pressure detection
MAP represents the pulse pressure or the highest PPG amplitude. The precise location depends on the quality of the amplitude. This section introduces techniques to improve the MAP estimation by addressing the following issues: (1) precise peak-to-peak amplitude calculation and (2) removing the drift’s effect.
Peak-to-peak amplitude calculation. The following equation provides a consistent estimation of each cycle’s amplitude, denoted as ampi, by suppressing the random order of appearance between the first peak and first bottom (Figure 9).

Figure 9. Illustration of the inconsistency of conventional peak-to-peak computation.

Figure 10 (a) demonstrates the PPG signal variation with respect to reducing pressure. The bottom panel displays a PPG signal sample from 150th to 170th s. Figure 10 (b) shows the corresponding amplitude using the peak-to-peak method.

Figure 10. In-ear PPG signal (a) with corresponding amplitude and pressure (b).
Drift removal. To detect the correct MAP point instead of ones belonging to the drift, we impose an additional criterion leveraging the local maxima property. Specifically, MAP is not only the maximum amplitude point, it also indicates the pulse amplitude transient state of increasing to decreasing as shown in Figures 715 and 10. By contrast, points within the drift are not local maximums. Therefore, we employ the following steps to precisely detect the MAP:
- Detect pulse amplitude’s local maximums. This step confirms the removal of points belonging to the drift.
- The highest value of local maximums corresponds to the MAP location.
Based on the fundamental property of the DBP, which occurs at the highest decreasing amplitude, we formulate this as the minimum of the first derivative amplitude as shown in Figure 11. The dashed orange line represents the PPG amplitude, the solid purple is the first derivative, the dotted blue depicts the calibrated pressure, and the gray one is the PPG signal. In this example, the drift does not occur; thus, the MAP is the local maxima of the amplitude, in which its corresponding first-order derivative is approximately equal to 0. After the MAP, a rapid decrease is observed until the 43rd s, which corresponds to the minimal first order derivative and indicates the location of DBP.

Figure 11. First derivative of PPG amplitude discloses diastolic BP.
6. Evaluation
In this section, we present the set of experiments conducted to evaluate the overall performance of eBP and demonstrate the feasibility of using our BP device frequently in daily life. We first present the key results of performing BP measurements using the eBP system. Then, we evaluate different factors that can affect eBP’s performance. Finally, we analyze the users’ experience survey when using eBP.
We obtained the IRB approval to conduct experiments for the evaluation of eBP. The participant demographics is shown in the accompanying table. We tested eBP alongside an FDA-approved, gold standard, arm-cuff BP measurement device (KonQuest KBP-2704A5) (Figure 12). For assessment, we use the metric that is widely accepted by other BP studies, which consists of bias or mean error μ, a precision or standard deviation (SD) σ error, and a Pearson correlation coefficient ρ.

Figure 12. Experiment setup to compare eBP with the Kon-Quest device.
This experiment is tested on 35 participants of both genders and various ages. eBP participants place the in-ear balloon inside their ear. Next, the cuff of the KonQuest device is wrapped around the upper arm of each participant. We simultaneously measure the BP of each participant from our Android app running on the Samsung Galaxy S9 and the gold standard BP device. This process is repeated twice and takes about 20 min. We sterilize our device with an alcohol wipe, between each experiment, by softly cleaning the balloon tip and sensor. During the experiment, the participant has to sit still to ensure the BP reading is correct. In addition, the balloon needs to be mounted in the right position so that it will not fall out. It turns out that the ear can hold the sensor properly because the tragus helps to keep the sensor tight as shown in Figure 12.
In this section, we evaluate eBP performance and showcase the comparative results between eBP and the Kon-Quest KBP-2704A.
Figure 13 shows the Bland-Altman diagram that describes the average error between eBP and the ground-truth. Consequently, the mean and SD error of SBP and DBP are 1.8 mmHg and 3.1 mmHg, which is within the Association for the Advancement of Medical Instrumentation’s (AAMI) requirement (μAAMI < 5 mmHg).24 In addition, our SD errors for SBP and DBP also satisfy the criteria where σAAMI < 8 mmHg.24 On the other hand, Figure 14 displays the Pearson correlation coefficients of SBP and DBP measurements by eBP and the KonQuest device. We select five participants’ data for calibration using a polynomial regression model. There were some error cases where the measurement was performed without taking sufficient stability. For example, the balloon fell out of the ear because of sweat, movement, or the ear canal was too narrow. When the balloon falls out, there is no valid pulsatile waveform detected. As a result, the system cannot predict the BP, thus, providing no data for the evaluation. The correlation shown of 0.81/1.0 for the SBP and 0.76/1.0 for the DBP represents that our system’s prediction is highly correlated to that of the FDA approved device.

Figure 13. Bland-Altman plot comparing eBP’s measurements and groundtruth.

Figure 14. Pearson correlation coefficients of eBP’s estimation and groundtruth.

Table. Demographic description of participants.
We measure the power consumption of both eBP hardware module and eBP app (installed on a Samsung Galaxy S9) in two scenarios: (1) during BP measurement and (2) without BP measurement. eBP hardware module power consumption is measured using Monsoon Power Monitor. eBP app power consumption is measured using AccuBattery application. Note that the power measurement of eBP hardware is done in 1 min, whereas it takes 9 min to obtain a reliable measurement from AccuBattery app. eBP hardware consumes 1279.28 and 31.34 mW during BP measurement and without BP measurement, respectively. eBP app consumes 1406 and 1119 mW during eBP measurement and without BP measurement, respectively. In summary, eBP hardware consumes 1247.94 mW (1279.28–31.34 mW) to operate the pump, the valve, the LED, and the microcontroller. eBP app consumes 287 mW (1406–1119 mW) for BP calculation.
We conducted experiments to verify the robustness of our calibration procedure based on polynomial fitting. We replicated the process by taking 250 randomly picked times from the learning set. Finally, we explore the frequencies of mean and SD error as shown in Figure 15. Overall, the highest frequencies of both SBP and DBP mean error falls between 4 and 5 mmHg, which satisfies AAMI standards. Similarly, the highest frequency of SD errors is less than 8 mmHg, which also qualifies the AAMI protocol. In addition, 9 out of 35 candidates proceed 10 times of data collection to calculate the intraclass correlation coefficient (ICC). Figure 16 shows the ICC result of each candidate. The average ICC of SBP and DBP are 0.8 and 0.76, respectively.

Figure 15. Mean and SD error in cross validation.

Figure 16. Intraclass correlation coefficient of eBP and groundtruth.
We refer the readers to the works of Bui et al.8 for more detailed validations of optimal sensor locations, user study, and our discussion on the limitations of eBP.
7. Conclusion
In this paper, we presented eBP, a new method to capture BP from inside the ear, which measures the artery BP from the superficial artery near the ear canal. Existing techniques that measure BP on the arm or wrist cannot be applied to measure BP from inside the ear as the required fixed systolic and diastolic detection ratios. We developed our model to estimate the in-ear BP by observing the behavior of pulse amplitude. Therefore, no constant parameters are required in our proposed model. In this paper, we also introduce a technique to customize an off-the-shelf catheter to become our in-ear pulse pressure sensor. We built custom hardware and software for eBP and evaluated the system through a comparative study on 35 subjects. The study shows that eBP obtains an average error of 1.8 and –3.1 mmHg and standard deviation error of 7.2 and 7.9 mmHg for systolic (high-pressure value) and diastolic (low-pressure value), respectively. These errors are within the acceptable margins regulated by FDA’s AAMI protocol, which allows average BP difference of up to 5 mmHg and standard deviation of up to 8 mmHg. These promising results not only show the feasibility of an in-ear blood monitoring concept but also open up the possibility of making current gold standard cuff-based BP measurement more comfortable.
Broaden applications. Although eBP is currently a standalone device, with the continued trend of incorporating biometric monitoring into devices12, 21 that are worn on a daily basis, there would be minimal behavioral changes required on the part of the wearer to benefit from eBP. As ear-worn sensing platforms such as Earable22 and eSense13 are becoming increasingly popular, the BP monitoring modality could potentially be integrated into these platforms. It enables the ability, which is not possible before, to sense and react to various dangerous diseases and conditions in daily life such as hypertension, epileptic seizures, etc. Additionally, eBP could also be incorporated with a headphone or hearing aid, both of which are ubiquitous as the World Health Organization reports that approximately 466 million people worldwide suffer from disabling hearing loss20 and more than 365 million headphones were sold in 2017 in the US alone.11 In addition, our proposed BP calculation algorithm can be applied to make existing cuff devices more comfortable. In the case of hardware design, the use of a medical balloon to deliver a sensor into the ear can widely benefit other applications. For example, it can improve the contact points and the conductivity of electrodes for the in-ear sensing area.
Acknowledgments
This research is based in part upon work supported by NSF CNS/CSR 1846541, NSF SCH 1602428, Google Faculty Awards 2018, the Schramm Foundation and the Colorado Advanced Industries Accelerator (AIA).
 This work is licensed under a


Join the Discussion (0)
Become a Member or Sign In to Post a Comment