Three-dimensional integrated circuit (3D IC) with through-silicon-via (TSV) is believed to offer new levels of efficiency, power, performance, and form-factor advantages over the conventional 2D IC. However, 3D IC involves disruptive manufacturing technologies compared to conventional 2D IC. TSVs cause significant thermomechanical stress that may seriously affect performance, leakage, and reliability of circuits. In this paper, we discuss an efficient and accurate full-chip thermomechanical stress and reliability analysis tool as well as a design optimization methodology to alleviate mechanical reliability issues in 3D ICs. First, we analyze detailed thermomechanical stress induced by TSVs in conjunction with various associated structures such as landing pad and dielectric liner. Then, we explore and validate the linear superposition principle of stress tensors and demonstrate the accuracy of this method against detailed finite element analysis (FEA) simulations. Next, we apply this linear superposition method to full-chip stress simulation and a reliability metric named the von Mises yield criterion. Finally, we propose a design optimization methodology to mitigate the mechanical reliability problems in 3D ICs.
1. Why 3D IC?
A major focus of the semiconductor industry in the last 45 decades has been to miniaturize ICs by advanced lithography patterning technology, which is now around 22 nm node. While ITRS still predicts further CMOS scaling, for example, to around 7 nm node by the year of 2020,7 such scaling will reach fundamental physical limit, or even before that happens, the economy of scaling will require other means for “more Moore” and “more than Moore” integration.
Due to the increasing power, performance, and financial bottlenecks beyond 3222 nm, industry began to look for alternative solutions. This has led to the active research, development, and deployment of thinned and stacked 3D ICs, initially by wire-bond, later by flip-chip, and recently by through-silicon-via (TSV).18
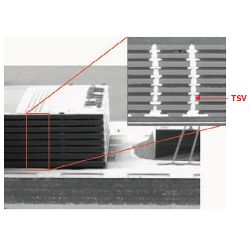
TSV is the key enabling technology in 3D IC as depicted in Figure 1. This TSV provides vertical signal, power, and thermal paths between the dies in a stack. With 3D integration technology employing TSVs, both the average and maximum distance between components can be substantially reduced by placing them on different dies, which translates into significant savings in delay, power, and area. Moreover, it enables the integration of heterogeneous devices, such as 28 nm for high-speed logic and 130 nm for analog, making the entire system more compact and efficient.
Recently, 64 parallel processor cores with stacked memory12 and a large-scale 3D CMP with a cluster-based near-threshold computing architecture4 have been demonstrated from academia. Moreover, a heterogeneous 3D FPGA (Xilinx Virtex-7 FPGA) has been already in mass production.22 However, this new design element, that is, TSV, causes several challenges. The thermomechanical reliability problem caused by TSV-induced stress is one of the biggest challenges in 3D ICs.
2. Thermomechanical Stress in 3D ICs
Due to the significant coefficients of thermal expansion (CTE) mismatch between TSV fill material such as copper (= 17 ppm/K) and silicon substrate (= 2.3 ppm/K), thermomechanical stress builds up during 3D IC fabrication process and thermal cycling of TSV structures. Because the copper (= Cu) annealing temperature is much higher than the operating temperature, tensile stress appears on silicon after cooling down to room temperature. This thermomechanical stress can affect both chip performance and reliability.
In semiconductors, changes in interatomic spacing resulting from strain affect the bandgaps, making it easier or harder for electrons—depending on the material and strain—to be raised into the conduction band. This results in a change in resistivity of the semiconductor, which can also be translated to a change in mobility.8 In sub-100 nm nodes, the strained silicon technology has been widely used to boost carrier mobility in the transistor channel. TSV-induced stress affects the carrier mobility on top of this strained silicon and acts as an additional variation source. In fact, the tensile stress induced by TSV affects electron and hole mobility in the opposite direction. Thus, if designers do not take care of this mobility variation in the chip design stage, the intended chip performance is not guaranteed. Previous works2, 23 discussed the impact of TSV-induced stress on individual device performance as well as full-chip timing.
Meanwhile, there have been major concerns on the thermomechanical reliability of TSV structures. If there is a small defect such as a void around a TSV, TSV-induced stress can drive the interfacial cracking between dielectric liner and silicon substrate or the cohesive cracking in dielectric liner and silicon substrate as shown in Figure 2.15 These cracks may damage transistors nearby, create conducing paths between TSVs (= short circuit), and cause the entire chip operation failure in the worst case. Previous works studied the crack growth behavior under TSV stress.9, 14, 19 However, most previous works focused on modeling the thermomechanical stress and reliability of a single TSV in isolation. These simulations were performed using finite element analysis (FEA) methods which are computationally expensive or infeasible for full-chip-scale analysis.
In this paper, we present a full-chip TSV thermomechanical stress and reliability analysis flow which overcomes the limitation of the FEA method. In addition, we provide a design optimization methodology to reduce mechanical reliability problems in TSV based 3D ICs. To obtain realistic stress distributions across a chip, we first model detailed and practical TSV structures and study their impact on stress, which lacked in many previous works mainly because the design context is not considered. Then, we validate the principle of linear superposition of stress tensors against FEA simulations, and apply this methodology to generate a stress map and a reliability metric map on a full-chip scale. In addition, we present design methods to reduce von Mises stress, which is a mechanical reliability metric that identifies mechanically unstable spots such as crack vulnerable locations, on full-chip 3D IC designs by tuning design parameters such as liner thickness and TSV placement.
3. Baseline Modeling
 3.1. Limitation of existing works
The analytical 2D radial stress model, known as Lamé stress solution, was employed to address the TSV thermomechanical stress effect on device performance in Yang et al.23 This 2D plane solution assumes an infinitely long TSV embedded in an infinite silicon substrate and provides stress distribution in silicon substrate region, which can be expressed as follows16:

where σSi is stress in silicon substrate, E is Young’s modulus (= a measure of stiffness of an elastic material), Δα is mismatch in CTE, ΔT is differential thermal load, r is the distance from TSV center, and DTSV is TSV diameter.
Even though this closed-form formula is easy to handle, this 2D solution is only applicable to the structure with TSV and substrate only, hence inappropriate for the realistic TSV structure with landing pad and liner. Also, it does not capture the 3D nature of a stress field near the wafer surface around TSVs where devices are located. Moreover, the TSV/substrate interface region near the wafer surface is known to be a highly problematic area for mechanical reliability.19 In our study, the wafer surface means the silicon surface right below substrate (Si)/dielectric layer (SiO2) interface.
Though the authors in Ryu et al.19 proposed a semi-analytic 3D stress model, it is only valid for TSV with a high aspect ratio. Also, their TSV structure only includes TSV and silicon substrate, hence we cannot apply their model to TSV which contains landing pad and dielectric liner because of the change in boundary conditions. Furthermore, since their model is only applicable to a single TSV in isolation, it cannot be directly used to assess mechanical reliability issues in a full-chip scale.
Since there is no known analytical stress model for a realistic TSV structure, 3D FEA models for a TSV structure are created to investigate the stress distribution near wafer surface. To realistically examine the thermomechanical stress induced by TSVs, our baseline simulation structure of a TSV is based on the fabricated and the published data,3, 14 as shown in Figure 3.
We construct two TSV cells, that is, TSVA and TSVB, which occupy three and four standard cell rows in NCSU 45 nm technology.6 We define 1.205 μm and 2.44 μm from TSV edge as keep-out zone (KOZ) in which no cell is allowed to be placed for TSVA and TSVB cells, respectively. Our baseline TSV diameter, height, Cu diffusion barrier thickness, liner thickness, and landing pad size are 5 μm, 30 μm, 50 nm, 125 nm, and 6 μm, respectively, unless otherwise specified, which are close to the data in der Plas et al.3 We use SiO2 and Ti as a baseline liner and a Cu diffusion barrier material, respectively. Material properties used for our experiments are listed in Table 1. We use the commercial FEA simulation tool ABAQUS to perform experiments, and all materials are assumed to be linear elastic and isotropic. Also, perfect adhesion is assumed at all material interfaces.17
Before discussing the detailed stress modeling results, we introduce the concept of a stress tensor. Stress at a point in an object can be defined by the nine-component stress tensor:

where, the first index i indicates that the stress acts on a plane normal to the i axis, and the second index j denotes the direction in which the stress acts. If index i and j are same we call this a normal stress, otherwise a shear stress. Since we adopt a cylindrical coordinate system in this modeling for the cylindrical TSV, index 1, 2, and 3 represent r, θ, and z, respectively.
Figure 4 shows FEA simulation results of a normal stress components σrr and σθθ along an arbitrary radial line from the TSV center at the wafer surface with ΔT = 250°C of thermal load. That is, we assume TSV structure is annealed at 275°C and cooled down to 25°C to mimic the manufacturing process.11, 16, 19 We also assume that the entire TSV structure is stress free at the annealing temperature.
In our 3D FEA simulations we consider TSV surrounding structures such as dielectric liner and landing pad as well, while the 2D model only considers TSV and substrate which are infinitely long in z-direction. Due to this structural difference, we observe the huge discrepancy between 2D solution and 3D stress results at the TSV edge. It is widely known that most of mechanical reliability failures occur at the interface between different materials, hence this TSV edge is the critical region for the reliability. Therefore, the 2D solution does not predict mechanical failure mechanism for TSVs correctly. Also, SiO2 liner, which acts as a stress buffer layer, reduces σrr stress at the TSV edge by 35 MPa compared with the case without landing pad and liner. The landing pad also helps decrease stress magnitude at the TSV edge.
We also employ benzocyclobutene (BCB), a polymer dielectric material, as an alternative TSV liner material.16, 19 Since Young’s modulus, which is a measure of the stiffness of an elastic material, of BCB is much lower than Cu, Si, and SiO2, this BCB liner can absorb the stress effectively induced by CTE mismatch. Figure 5 shows the impact of liner material and its thickness on σrr stress component. As liner thickness increases, the stress magnitude at the TSV edge decreases noticeably, especially for the BCB liner case.
It is evident from these simulations that modeling stress distribution considering surrounding structures such as liner and landing pad is important to analyze the thermomechanical stress around TSVs more accurately. We construct a stress library by varying TSV diameter/height, landing pad size, and liner material/thickness to enable full-chip thermomechanical stress and reliability analysis with different TSV structures.
4. Full-Chip Reliability Analysis
FEA simulation of thermomechanical stress for multiple TSVs require huge computing resources and time, thus it is not suitable for full-chip analysis. In this section, we present a full-chip thermomechanical stress and reliability analysis flow. To enable a full-chip stress analysis, we first explore the principle of linear superposition of stress tensors from individual TSVs. Based on the linear superposition method, we build full-chip stress map and then compute von Mises yield metric to predict mechanical reliability problems in TSV-based 3D ICs.
4.1. Overview of our full-chip analysis flow
In this section, we briefly describe our full-chip thermomechanical stress and reliability analysis flow. We first perform a detailed FEA simulation of a single TSV and provide the stress tensors along a radial line from the TSV center as an input to our simulation engine. We also provide the locations of the TSVs from 3D IC layout along with a thermal map to the simulation engine. With these inputs, we find a stress influence zone from each TSV. Then, we associate the points in the influence zone with the affecting TSV. Next, for each simulation point under consideration, we look up the stress tensor from the TSV found in the association step, and use the coordinate conversion matrices to obtain stress tensors in the Cartesian coordinate system. We visit an individual TSV affecting this simulation point and add up their stress contributions. Once we finish the stress computation at a point, we calculate the von Mises stress value. The complexity of this algorithm is O(n), where n is number of simulation points.
4.2. Mechanical reliability metric
In order to evaluate if computed stresses indicate possible reliability concerns, a critical value for a potential mechanical failure must be chosen. The von Mises yield criterion is known to be one of the most widely used mechanical reliability metric.5, 21, 24 If the von Mises stress exceeds a yielding strength, material yielding starts. Prior to the yielding strength, the material will deform elastically and return to its original shape when the applied stress is removed. However, if the von Mises stress exceeds the yield point, some fraction of the deformation will be permanent and nonreversible even if applied stress is removed.
There is a large variation of yield strength of Cu in the literature, from 225 MPa to 600 MPa, and it has been reported to depend upon thickness, grain size, and temperature.24 We use 600 MPa as a Cu yielding strength in our experiments. The yield strength of silicon is 7000 MPa, which will not be reliability concerns for the von Mises yield criterion.
The von Mises stress is a scalar value at a point that can be computed using components of a stress tensor. By evaluating von Mises stress at the interface between TSV and dielectric liner, where highest von Mises stress occurs, we can predict mechanical failures in TSVs.
4.3. Stress analysis with multiple TSVs
Based on the observation that the stress field of a single TSV in isolation is radially symmetrical due to the cylindrical shape of a TSV, we obtain stress distribution around a TSV from a set of stress tensors along an arbitrary radial line from the TSV center in a cylindrical coordinate system. To evaluate a stress tensor at a point affected by multiple TSVs, a conversion of a stress tensor to a Cartesian coordinate system is required. This is due to the fact that we extract stress tensors from a TSV whose center is the origin in the cylindrical coordinate system; hence we cannot perform a vector sum of stress tensors at a point from each TSV which has a different center location. That is why we need a universal coordinate system, that is, Cartesian coordinate system in this case.
Then, we compute a stress tensor at the point of interest by adding up stress tensors from TSVs affecting this point. We set a TSV stress influence zone as 25 μm from the center of a TSV with 5 μm diameter, since the magnitude of stress components becomes negligible beyond this distance, which has been verified by FEA simulations.
Let the stress tensor in Cartesian and cylindrical coordinate system be Sxyz and Srθz, respectively.

The transform matrix Q is the form:

where, θ is the angle between the X axis and a line from the TSV center to the simulation point. A stress tensor in a cylindrical coordinate system can be converted to a Cartesian coordinate system using conversion matrices: Sxyz = QSrθz QT.
4.4. Linear superposition method
A useful principle in the analysis of linearly elastic structures is that of superposition. The principle states that if the displacements at all points in an elastic body are proportional to the forces producing them, the body is linearly elastic. The effect, that is, stresses and displacements, of a number of forces acting simultaneously on such a body is the sum of the effects of the forces applied separately. We apply this principle to compute the stress at a point by adding the individual stress tensors at that point caused by each TSV as follows:

where, S is the total stress at the point under consideration and Si is the individual stress tensor at this point due to the ith TSV.
We validate the linear superposition of stress tensors against FEA simulations by varying the number of TSVs and their arrangement. We set minimum TSV pitch as 10 μm for all test cases. Stress tensors along a radial line from the TSV center in a single TSV structure (stress tensor list) are obtained through FEA simulation with 0.1 μm interval. In our linear superposition method, simulation area is divided into uniform array style grid with 0.05 μm pitch. If the stress tensor at a grid point under consideration is not obtainable directly from the stress tensor list, we compute stress tensor at the point using linear interpolation with adjacent stress tensors in the list.
Table 2 shows some of our comparisons. First, we observe huge run time reduction in our linear superposition method. Note that we perform FEA simulations using 4 CPUs while only one CPU is used for our linear superposition method. Even though our linear superposition method performs stress analysis on a 2D plane at the wafer surface, whereas FEA simulation is performed on entire 3D structure, we can perform stress analysis for other planes in a similar way if needed. Also, run time in our linear superposition method shows linear dependency on the number of simulation points, which is closely related to the number of TSVs under consideration. Thus, our linear superposition method is highly scalable, hence applicable to full-chip scale stress simulations.
Most importantly, error between FEA simulations and the linear superposition method is practically negligible. Results show that our linear superposition method overestimates stress magnitude inside TSV. However, though maximum % error inside TSV of 10 TSVs case is as high as 13.6%, stress magnitude difference between FEA and our method is only 5.0 MPa. Also, since most mechanical problems occur at the interface between different materials, this error inside TSV does not pose a serious impact on our reliability analysis. Figure 6 shows the von Mises stress map for one of test cases which contains 10 TSVs, and it clearly shows our linear superposition method matches well with the FEA simulation result.
5. Full-Chip Simulation Results
We implement a TSV-aware full-chip stress and reliability analysis flow in C++/STL. Four variations of an industrial circuit, with changes in TSV placement style and TSV cell size, are used for our analysis, which are listed in Table 3. The number of TSVs and gates are 1472 and 370K, respectively, for all cases. These circuits are synthesized using Synopsys Design Compiler with the physical library of 45 nm technology,6 and final layouts are obtained using Cadence SoC Encounter. All circuits are designed to two-die stacked 3D ICs.
We use our in-house 3D placer for TSV and cell placement, and details of TSV and cell placement algorithms can be found in Kim et al.13 In the regular TSV placement scheme, we pre-place TSVs uniformly on each die, and then place cells, while TSVs and cells are placed simultaneously in the irregular TSV placement scheme. The irregular TSV placement shows better wirelength than the regular case.13
In this section, we discuss the impact of TSV structure, TSV placement style, and KOZ size on the thermomechanical reliability in 3D ICs. We perform full-chip stress and reliability analysis on our benchmark circuits based on our stress modeling results with different TSV structures.
Figure 7 shows the maximum von Mises stress in our benchmark circuits. We first observe that designs with irregular TSV placement show worse maximum von Mises stress than those with the regular TSV placement. This is mainly because TSVs can be placed closely in case of the irregular TSV placement scheme to minimize wirelength. Figure 8 shows the part of von Mises stress maps of IrregA and RegA circuits, and we see that most of TSVs in the IrregA circuit exceed Cu yielding strength (600 MPa).
Second, as the KOZ size becomes larger, stress level reduces significantly for the irregular TSV placement case. By enlarging the KOZ size, that is, increasing TSV cell size in our design flow, TSV pitch increases accordingly. This in turn reduces stress interference between nearby TSVs, and hence decreases von Mises stress level of TSVs. However, for the regular TSV placement case, since the TSV pitch of RegA (23.5 μm) and RegB (25 μm) are similar and also interference from nearby TSVs is negligible at this distance, there is no noticeable difference in maximum von Mises stress.
Third, these results show the importance of using an accurate TSV stress model to assess the mechanical reliability of 3D ICs. There are significant differences in the von Mises stress depending on the existence of structures surrounding a TSV, such as landing pad or liner. It is possible that we might overestimate the reliability problems by using a simple TSV stress model not considering landing pad or liner. However, most of these test cases violate the von Mises yield criterion for Cu TSV. Section 5.4 shows how TSV liners help reduce the violations.
TSV pitch is the key factor that determines stress magnitude in the substrate region between TSVs. In this section, we explore the effect of TSV pitch on von Mises stress. We place TSVs regularly on 1 × 1 mm2 chip. We use 1600, 2500, 4356, and 10000 TSVs whose pitches are 25, 20, 15, and 10 μm, respectively. We obtain two data sets; one without landing pad, liner, and barrier; and another with 6 × 6 μm2 landing pad, 125 nm thick BCB liner, and 50 nm thick Ti barrier.
We first observe that von Mises stress magnitude decreases with increasing pitch and starts to saturate at around 15 μm pitch as shown in Figure 9. This is understandable since the stress magnitude induced by a single TSV becomes negligible at the similar pitch. Also, the layout using TSVs with landing pad and BCB liner shows a similar trend with lower von Mises stress magnitude than the case without these structures.
To investigate the effect of the TSV size, we use three different sizes of TSV with a same aspect ratio of 6; TSV small (H/D = 15/2.5 μm and KOZ 1.22 μm), TSV medium (H/D = 30/5 μm and KOZ 1.202 μm), and TSV large (H/D = 60/10 μm and KOZ 1.175 μm), where H/D is TSV height/diameter. Note that these TSV cells are occupying two, three, and five standard cell rows, respectively, which are selected to minimize the KOZ size difference between them. By setting similar KOZ size, we can focus on the impact of TSV size solely. Additionally, we set the landing pad width is 1 μm larger than the corresponding TSV diameter, and use 125 nm thick SiO2 liner and 50 nm thick Ti barrier for all cases for fair comparisons.
Table 4 shows the maximum von Mises stress. For both irregular and regular TSV placement schemes benefit from smaller TSV diameter significantly. This is mainly because the magnitude of normal stress components decays proportional to (D/2r)2, where r is the distance from the TSV center.
5.4. Impact of liner thickness
In this section, we examine the impact of liner thickness on von Mises stress. We use designs with both TSVA cells and TSVB cells, and set the landing pad size 6 × 6 μm2 and 8 × 8 μm2, respectively. We also use 50 nm thick Ti barrier for all cases. Figure 10 shows the maximum von Mises stress results with liner thickness of 125 nm, 250 nm, and 500 nm.
We observe that liner thickness has a huge impact on the von Mises stress magnitude, since the thicker liner effectively absorbs thermomechanical stress at the TSV/liner interface. Especially, the BCB liner shows significant reduction in the maximum von Mises stress compared with SiO2 liner due to extremely low Young’s modulus shown in Table 1. For example, 500 nm thick BCB liner reduces the maximum von Mises stress by 29% for the IrregA and satisfies the von Mises yield criterion for all circuits with a regular TSV placement.
Table 5 shows the number of TSVs violating von Mises criterion. Even though there are still many TSVs not satisfying von Mises criterion for the IrregA circuit, it is possible to reduce von Mises stress if we place TSVs carefully considering this reliability metric during a placement stage.
5.5. Impact of TSV placement optimization
In this section, we manually optimize TSV locations to show the potential benefit of TSV reliability aware layout optimization while minimizing the change in layout. We use the IrregA circuit which shows the worst von Mises stress, and employ 500 nm thick BCB liner for this experiment. Our related study with this BCB liner on the maximum von Mises stress vs. TSV-to-TSV pitch shows that 10 μm pitch is a reasonable choice to reduce von Mises stress considering some safety margin. We reposition densely placed TSVs to nearby white spaces if available to reduce the von Mises stress shown in Figure 11.
Table 6 shows the distribution of von Mises stress higher than 480 MPa across the die, wirelength, and longest path delay before and after the TSV replacement. We perform 3D static timing analysis to analyze timing using Synopsys PrimeTime with TSV parasitic information included. We see the reduction in high von Mises stress region after TSV replacement. With small perturbations of TSV locations, we could reduce the von Mises stress level and decrease the number of violating TSVs from 329 to 261, which is 21% improvement with only 0.23% wirelength and 0.81% longest path delay (LPD determines the maximum chip operating frequency) increase, respectively. This small test case shows the possibility of a layout optimization without degrading performance too much.
6. Concluding Remarks
We presented an accurate and fast thermomechanical stress and reliability analysis flow based on the linear superposition principle of stress tensors, which overcomes the limitation of FEA tools, that is, huge computing resources and time. Hence, our method is applicable to large-scale mechanical reliability analysis for TSV-based 3D ICs. Designers can utilize our tool to assess mechanical reliability problems in the 3D IC design and to explore design trade-offs between footprint area, performance, and reliability.
We have worked on a few follow-up studies related to the thermomechanical reliability issues for TSV-based 3D IC. In Jung et al.,9 we examined the relation between mechanical stress and interfacial crack growth in TSVs. We computed the so called energy release rate (ERR) metric using FEA simulations to measure the probability of a given initial crack in a TSV to grow further. Our studies showed that linear superposition does not hold for ERR calculation for full-chip design. We then employed the response surface model (RSM) method to obtain highly accurate full-chip ERR maps based on our baseline FEA simulations. In Jung et al.,10 we studied the impact of off-chip elements such as micro-bumps and package bumps on the mechanical reliability of the dies in the 3D stack. Our baseline FEA structure was extended to include these off-chip elements. Related results showed that package bumps lead to a significant background compressive stress to all dies in the stack, which in turn cause the stress contours to shift downward. We developed the so called lateral and vertical linear superposition (LVLS) method to handle stress contributions from off-chip elements in different tiers and obtain full-chip stress map.
Another related study was to investigate how these stress factors (both on-chip and off-chip elements) affect the mobility of the devices nearby and the full-chip timing of 3D ICs.23 This stress-aware timing information was then used to guide full-chip placement and optimization.1 Table 1 shows the properties of various materials used in TSV and 3D ICs. Each of these values, however, can vary among TSVs and among the grains inside a single TSV depending on the process technologies used. We are currently looking into the impact of these material property variations on the distribution of mechanical stress tensors, device mobility variations, and full-chip timing and reliability. Lastly, these thermomechanical stress issues are closely related to the electrical reliability of 3D ICs. In Zhao et al.,25 we examined the impact of TSV stress on electro-migration for power/ground TSVs and the long-term reliability of the power distribution network (PDN) in 3D ICs.
These thermo-electro-mechanical reliability issues in 3D ICs call for holistic multi-physics-based approaches for more effective design solutions. In addition, the industry needs strong collaboration between designers and manufacturers to better tackle these burning issues in TSV and 3D IC and accelerate mainstream acceptance.
Acknowledgments
This work is supported in part by the National Science Foundation under Grants No. CCF-1018216, CCF-1018750, IBM Faculty Award, and Intel Corporation.
Figures
 Figure 1. Samsung 16Gb NAND stack (eight 2Gb NAND) with TSV.20
 Figure 2. Crack growth due to thermomechanical stress.15 (a) Interfacial crack between dielectric liner and silicon substrate; (b) cohesive crack in silicon substrate.
 Figure 3. Baseline TSV structure. (a) TSVA cell occupying three standard cell rows (KOZ = 1.205 μm). (b) TSVB cell occupying four standard cell rows (KOZ = 2.44 μm).
 Figure 4. Effect of TSV structures on normal stress components. (a) σrr stress; (b) σθθ stress.
 Figure 5. Effect of liner material/thickness on σrr stress.
 Figure 6. Sample stress comparison of von Mises stress between FEA simulation and linear superposition method. (a) FEA result; (b) ours; (c) FEA vs. ours along the white line in (a).
 Figure 7. Impact of TSV structure, TSV placement style, and KOZ size on the maximum von Mises stress. (a) Designs with TSVA cell (KOZ = 1.205 μm) and (b) those with TSVB cell (KOZ = 2.44 μm).
 Figure 8. Close-up shots of layouts and von Mises stress maps: (a) IrregA, (b) RegA, (c) von Mises stress map of IrregA, and (d) von Mises stress map of RegA.
 Figure 9. Impact of TSV pitch on maximum von Mises stress.
 Figure 10. Impact of liner thickness on the maximum von Mises stress of circuits with TSVA cell.
 Figure 11. TSV replacement to reduce von Mises stress. TSV landing pads are white rectangles. (a) Original layout; (b) after TSV replacement.
Tables

 Table 2. Von Mises stress comparison between FEA simulations and linear superposition method.

 Table 4. Impact of TSV size on the maximum von Mises stress. The numbers in parentheses are % reduction compared to TSV large case.
 Table 5. Impact of liner thickness on the number of TSVs violating von Mises criterion. The numbers in parentheses are % reduction compared to the 125 nm thick liner case.
 Table 6. Impact of TSV placement optimization on von Mises stress distribution, wirelength, and longest path delay.


Join the Discussion (0)
Become a Member or Sign In to Post a Comment