
Software developers regularly draw diagrams of their systems. To get a sense of how diagramming fits into a developer’s daily work, consider this fictitious, but representative story:
Jane is a developer who has been a member of her team so long that everyone calls her the team historian. Since the product just shipped a few weeks ago, Jane is finally getting around to some code cleanup she had planned for ages—namely, dropping a dependency on a library that is no longer supported. Jane uses her development environment to search for all the places where her product uses the unsupported library. She clicks through the results one by one and reads the code to understand how it uses the library. As she jumps around the code base, she sketches a class diagram on a notepad to capture the architectural dependencies she discovers.
Partway through this code-understanding task, there’s a knock at the door. It’s Joe, the newest member of the team. He is working on a bug and is confused about how one of the product’s features is implemented. As the team historian, Jane is accustomed to this type of question. They start the conversation by looking at an architectural diagram tacked to the wall near Jane’s computer. To get into specifics, Jane draws a version of the diagram on the whiteboard, sketching only the relevant parts of the architecture but in more detail than the printed diagram. As she talks Joe through a use case, she overlays the diagram with arrows to show how different parts of the system interact. From time to time, she brings up relevant code in her development environment to relate the diagram back to the code.
After several minutes, Joe feels confident he understands the design and heads back to his office. Jane goes back to her own work. Between exploring the search results and answering Joe’s questions, Jane’s development environment now has dozens of open documents. Jane tries to resume her task but cannot find where she left off in all the clutter. She closes all open documents, reissues her original search, finds her place in the search results, and carries on exploring the dependency on the unsupported library.
This story illustrates the wide range of diagramming practice. The diagrams range in quality from sketches to high-quality posters; in formality, from idiosyncratic scribbles to well-defined notations; in longevity, from the duration of a single task to an entire release cycle; and in audience, from solo use, to anchoring a conversation, to communicating with the whole team or user community.
Although the practice illustrated in the story is widespread and useful, there are a few downsides where software could make an improvement. First, the diagrams are typically not tied to the code. To go from architecture-level to code-level discussions requires switching tools—for example, from the whiteboard to the development environment. This separation also causes poor task support. For example, Jane’s code search and notepad diagram are not tied together in any way. The two can easily get out of sync and cannot be stored or retrieved together, as when Jane’s diagram was available during task resumption but her search results were gone.
Second, there is no transition between team-level documentation and task- or conversation-specific diagrams. For example, Jane has to reproduce parts of the poster on the whiteboard in order to answer Joe’s specific questions. Third, there is a lost opportunity to help deal with the disorientation Jane feels when confronting all the open documents on resuming her task.
Getting lost in a large code base is altogether too easy. The code consists of many thousands of symbols, with few visual landmarks to guide the eye. As a developer navigates the code, she follows hyperlinks, such as jumping from a method caller to a callee, with no visual transition to show where the jump landed. The more she navigates, the greater the pileup of document tabs. These navigation steps are not just for editing the code. Software developers also have a frequent need for information during their programming tasks.7,8 To try to find answers, they browse around the code and other documents, which adds both relevant and irrelevant documents to the environment’s working set. With so much discontinuous navigation, a developer can easily become disoriented.
Better support for code diagrams in the development environment could support code understanding and communication, and could serve as a “map” to help keep developers oriented. The software visualization community has previously explored different types of maps, such as zoomable box-and-line diagrams9 and cityscapes,10 for tasks such as program understanding and analyzing project data. These maps are typically designed to supplement a standard development environment. Our goal is to integrate maps into the development environment such that developers can carry out most tasks within the map.
To address these issues, using a user-centered approach we are designing an interactive code map for development environments. In preparation for our initial design we conducted a series of field studies at Microsoft Corporation. We interviewed developers to find how and why they draw diagrams of their code, and we collected many example diagrams along the way.3 We also directly observed developers at work to watch their information-seeking behavior and to catalog their information needs.7 Finally, we did a participatory design of a paper-based code map to allow a development team to design its content and appearance and to witness how it supported their conversations.1 Using insights from these three studies, we are actively prototyping Code Canvas, a Microsoft Visual Studio plug-in that replaces the tabbed documents with a zoomable code map.5
How and Why Developers Diagram
To better understand how professional software developers use visual representations of their code, we interviewed nine developers at Microsoft to identify common scenarios, and then surveyed more than 400 developers to understand the scenarios more deeply.3 The three most frequently mentioned scenarios were:
- Understanding existing code. Examining source code and its behavior to develop an understanding of it.
- Designing/refactoring. Planning how to implement new functionality, fix a bug, or make the program structure better match its functionality.
- Ad hoc meetings. Asking a coworker to explain existing code, vet a decision, or help work through a problem.
Developers rated these three among the most important to their job functions. More than half of survey respondents indicated that diagrams were important in these scenarios. Most ad hoc meetings were small, involving two or at most five people. While typically done solo, understanding existing code and designing/refactoring often involved pairs or small groups.
Better support for code diagrams in the development environment could support code understanding and communication, and could serve as a “map” to help keep developers oriented.
In a separate study we sought to understand developers’ information needs while carrying out their development tasks.7 We observed 17 developers at Microsoft for approximately 90 minutes each, manually recorded their activity minute by minute, and coded these logs into 334 instances of information-seeking behavior. From this data, we identified 21 general information needs, clustered into seven work categories. Consistent with the previous study, we found many of their information needs fell into the categories of understanding execution behavior and reasoning about design, see Table 1.
In our observations, ad hoc communication with coworkers was a common way of addressing a variety of information needs. Table 2 shows the information needs that were most frequently addressed by talking with coworkers. This reliance on conversations with coworkers corresponds with the ad hoc meeting scenario from the diagramming study.
From these two studies we know that developers have frequent, specific information needs when trying to understand existing code and planning code changes, and they often use diagrams when looking for answers. This suggests the plausible utility of a code map that answers these needs either directly or through interaction. We also know that developers often turn to coworkers to find the answers they need, and they create diagrams to supplement their conversations. This suggests that the code map should be shared among teammates so they have a common spatial frame of reference.
Designing a Code Map
The question remains, what should the code map look like? We collected many examples of developers’ visual representations of their code and identified the visual conventions they used.3 These ranged from sketches on whiteboards to diagrams carefully made using a drawing tool. We also looked at the visual conventions used by developers when representing code.2 Box-and-arrow diagrams were by far the most common representation, where each box represented some kind of software entity and each arrow indicated a relationship between two entities. Boxes were typically labeled, but arrows almost never were.
Some of these diagrams made casual use of visual notations, such as UML (Unified Modeling Language), but this was uncommon. Adjacency was sometimes used to indicate a relationship between two entities. Generally, boxes were arranged so that relationships flowed in a more-or-less orderly direction, top to bottom or left to right. High-level groupings were indicated by surrounding boxes or curves, or by dividing lines. These visual conventions suggest a starting point for the design of a code map.
Armed with this general knowledge, we worked closely with a software development team called Oahu (a pseudonym) to develop a paper prototype of a code map.2 The Oahu team consisted of a few dozen people working on an incubation project of around 75,000 lines of C#. We first had each developer separately sketch the Oahu project on a large piece of paper. Four of these sketches are shown in Figure 1. Next we synthesized into a master drawing the common features and interesting exceptions that appeared in the sketches. For several weeks we repeated a daily cycle where we printed this drawing, hung it in the developers’ offices, interviewed the team members for changes and reports of how they used it, and then revised the drawing based on their feedback. At their request, we incorporated types and method signatures reverse-engineered from their code, using a tool we developed for the purpose.
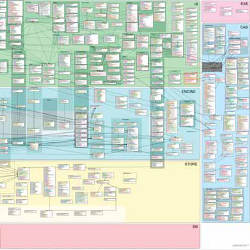
Through this process we arrived at a design (Figure 2) that represented the code in a way that was meaningful to the team. The final design was basically an architectural layer diagram sprinkled with types (white boxes) containing method signatures. It closely followed the visual conventions we found in the earlier study. It also included some features that are not typical in architectural diagrams, such as representations of planned, but nonexistent code (for example, the empty white box beneath the mobile phones), colorized identifier fragments to aid visual searching (which we call concept keyword colorization), and the vertical banding representing concepts that cut across architectural layers.
From these studies we learned that it is possible to design a code map from a simple set of visual conventions. The Oahu code map showed that a single map could represent an entire software project in a way that was meaningful to all the developers on the team. The team’s response to the map was mixed. Two new hires on the Oahu team used the map extensively as part of their “onboarding” process, studying and annotating it often. Other team members had several criticisms, all stemming from the lack of interaction. They wanted to tailor the level of detail and the element positions to the needs of the discussion to change the content for the task (for example, add call graphs to the map). We were able to address all these concerns in our Code Canvas.
Maps at the Center of the Development Environment
We’ve incorporated insights from these studies into a prototype user interface for Microsoft Visual Studio, called Code Canvas, which makes a code map the central metaphor of the development experience.5 Rather than relying on tabbed documents and hierarchical overviews to navigate and edit the code, Code Canvas places all of a project’s documents (code files, icons, user interface designs, among others) onto a panning, zooming code map. The user can zoom out to get an overview of the project’s structure and zoom in to view or edit code and other documents. (A video of Code Canvas is available at http://www.youtube.com/watch?v=tsFfyli2Y9s.)
We designed the look of the Code Canvas map based on our experience with the Oahu team. Figure 3 shows the Oahu project loaded into Code Canvas, in particular the upper left-hand corner of the UI layer (the area indicated with a dashed rectangle in Figure 2). Using the visual conventions from the Oahu map, the Code Canvas map shows types as white boxes, with the identifiers labeled using concept keyword colorization, and with types organized into labeled bands (Popup Menu, Reminders, among others). The type and concept boxes are positioned in Code Canvas in the same layout as the Oahu map.
An important lesson from the Oahu research is that developers assign meaning to the spatial layout of the code. Code Canvas therefore takes a mixed initiative approach to layout. The user is able to place any box on the map through direct manipulation, but Code Canvas also uses the MSAGL (Microsoft Automatic Graph Layout) engine (http://research.microsoft.com/msagl) to provide an initial layout for new code maps and to prevent occlusion and maintain relationships as the user makes subsequent changes to the layout.
Code Canvas uses a technique called semantic zoom to show different levels of detail at different levels of zoom. At the 10%-level of zoom, the code itself is invisible because its size is less than a pixel per line, but the type names and member names are shown at a readable size. The callout in Figure 3 shows the 100%-level of zoom, where the code file itself is displayed using the standard editor, which provides the usual syntactic formatting and coloring and standard editor features such as code completion. At intermediate levels of zoom the code becomes visible, first in a skeletal form (in the style of Seesoft,6 a well-known software visualization tool from the early 1990s), then as readable text.
For a tour of Code Canvas’s features, let’s replay our initial story.
Jane’s development environment shows an overview map of the whole project, called the HOME canvas. Its layout is as familiar to her as her hometown, since she has been moving around both of them for years. To start her task of understanding her project’s dependency on the unsupported library, she searches for uses of the library. The search results are overlaid on the map in yellow boxes (as shown in Figure 3) in addition to being listed in a separate window. She immediately sees the two parts of the code that depend on the library. She zooms into one of them to look closer at exactly which classes are implicated and then clicks on an individual search result to look at the code itself.
After exploring this way for a while, she decides to focus on just the relevant code, so she creates a new “filtered canvas” in a new tab that contains the subset of the code containing the search results, maintaining the spatial relationships that help her stay oriented. As on the HOME canvas, the code on the filtered canvas is shown inside boxes representing the relevant classes and interfaces. This filtered canvas acts as the class diagram Jane previously drew on her notepad, except here the search results and class diagram are automatically kept in sync and are persisted together.
Joe knocks on the door and asks Jane a question. She clicks over to the HOME canvas tab, zooms out, and points at parts of it to support what she’s saying. The HOME canvas is shared among all team members, precisely to provide a common ground around which the team can have discussions. To explain the feature that is puzzling Joe, Jane sets a debugger breakpoint and runs the program. When the breakpoint is reached, Code Canvas shows the call stack using a series of red execution arrows, like those in Figure 3. Jane then creates a second filtered canvas, focused on this call stack. She zooms out to give Jim a tour of the parts of the code involved in the feature. When Joe asks detailed questions about the algorithms, Jane zooms in on the relevant code. When the conversation with Joe is over, Jane simply closes the new tabs and returns to the one where she was working, which looks exactly as she left it.
In short, Code Canvas provides explicit task support through multiple canvases and uses stable, spatial layouts to keep users oriented. These design goals are shared by the Code Bubbles project at Brown University.1 Code Bubbles’ strategy is to start with an empty canvas and add items as the user searches and browses the project. In contrast, Code Canvas starts with an overview and allows users to filter down to items of interest. In our future work, we will explore hybrids of the two approaches.
Conclusion
Based the work practices we observed in our field studies, we believe making a code map central to the user interface of the development environment promises to reduce disorientation, answer common information needs, and anchor team conversations. Spatial memory and reasoning are little used by software developers today. In a lab-based evaluation of a previous version of our code-map design, we showed that developers form a reliable spatial memory of a code map during 90-minute sessions of programming tasks.4 By exploiting these cognitive resources, code maps will allow developers to be better grounded in the code, whether working solo or collaboratively. We believe this will fundamentally change and improve the software development experience.
![]() Related articles
Related articles
on queue.acm.org
Code Spelunking Redux
George V. Neville-Neil
http://queue.acm.org/detail.cfm?id=1483108
Visualizing System Latency
Brendan Gregg
http://queue.acm.org/detail.cfm?id=1809426
The Woes of IDEs
Jef Raskin
http://queue.acm.org/detail.cfm?id=864034
Figures
 Figure 1. Four diagrams of the Oahu system.
 Figure 2. The Oahu code map designed through team participation, with a callout showing the map at full resolution. The dashed rectangle is the map region shown in
 Figure 3. The Code Canvas version of the Oahu map, focused on the upper left corner of the UI layer. The map includes two overlays: search results in yellow and an execution trace as a series of red arrows. The callout shows the result of zooming into a method to edit its code.


Join the Discussion (0)
Become a Member or Sign In to Post a Comment